mirror of
https://github.com/kubesphere/website.git
synced 2025-12-26 00:12:48 +00:00
454 lines
17 KiB
Markdown
454 lines
17 KiB
Markdown
---
|
||
title: '在 KubeSphere 中使用 DevOps 部署 Java 微服务配置监控预警'
|
||
tag: 'KubeSphere, DevOps'
|
||
keywords: 'KubeSphere, microservice, DevOps, java'
|
||
description: '使用 KubeSphere 的流水线部署 Java 应用,使用 Prometheus 采集 Java 应用通过 spring actuator 暴露的监控数据,配置监控 dashbord 及监控信息。'
|
||
createTime: '2022-07-01'
|
||
author: '酱油瓶'
|
||
snapshot: 'https://pek3b.qingstor.com/kubesphere-community/images/kubesphere-devops-java-cover.png'
|
||
---
|
||
|
||
## 开发 Java 微服务并引入监控组件
|
||
|
||
我们基于 Spring Cloud +Nacos 开发 Java 微服务,Java 服务开发不做过多的叙述。
|
||
|
||
### 项目中引入 Actuator
|
||
|
||
我们在项目的 bom 中引入 Spring Boot Actuator,它提供了多种特性来监控和管理应用程序,可以基于 HTTP,也可以基于 JMX。
|
||
|
||
```java
|
||
<dependency>
|
||
<groupId>org.springframework.boot</groupId>
|
||
<artifactId>spring-boot-starter-actuator</artifactId>
|
||
</dependency>
|
||
```
|
||
### 配置 Actuator
|
||
引入 Actuator 后,原则上我们无需做任何配置即可使用,在我们项目中我们结合实际需求及提升安全性做了如下配置:
|
||
|
||
```java
|
||
management.health.elasticsearch.enabled=false
|
||
management.endpoints.web.exposure.include=*
|
||
management.endpoints.web.base-path=/api/actuator
|
||
management.metrics.tags.application=${service.name}
|
||
management.metrics.tags.appid=${service.appid}
|
||
management.server.port=8090
|
||
```
|
||
* management.server.port:启用独立的端口来提供监控,避免监控相关 api 暴露在服务外;
|
||
* management.metrics.tags.xxx:在统计信息中添加自定义的标签;
|
||
* management.endpoints.web.exposure.include:用于包含我们要公开的端点列表 , 我们这里设置为* 代表所有。
|
||
|
||
**观察应用程序监控数据**
|
||
|
||
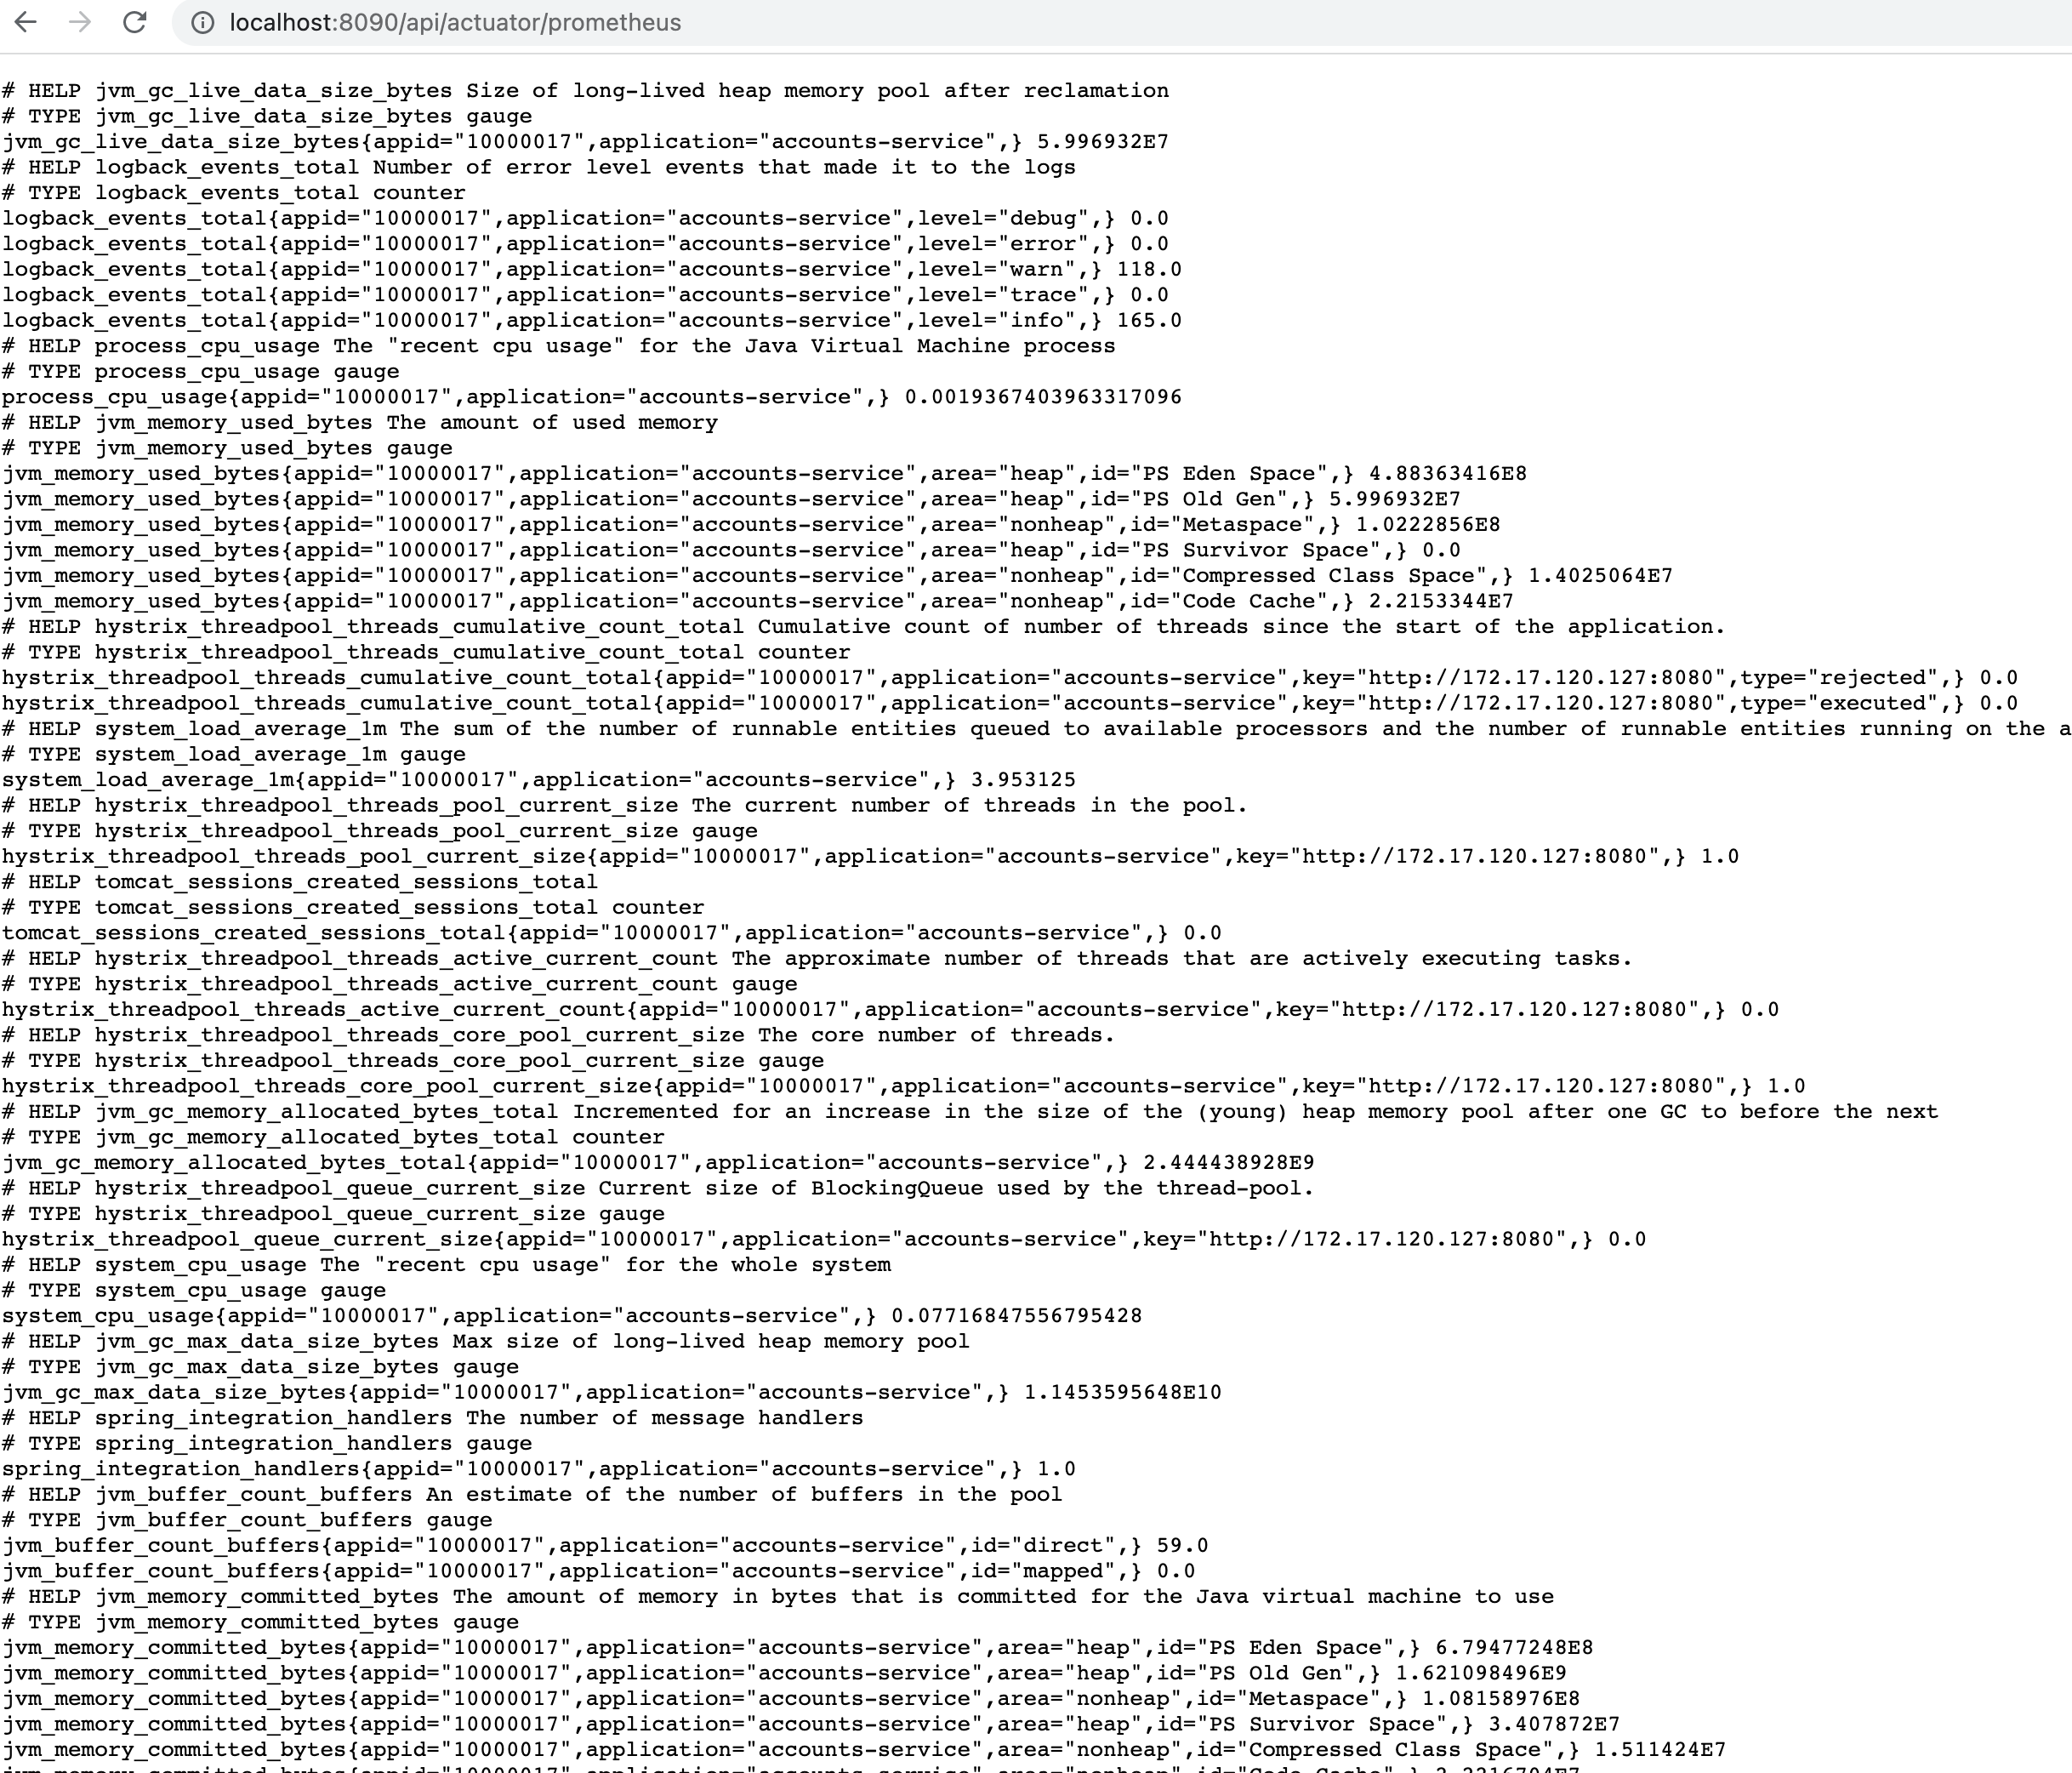
当我们运行编写好的程序后,通过访问 `http://localhost:8090/api/actuator/prometheus` 可以看到类似如下数据,其中就有我们通过配置添加的 tag 数据,后续我们部署的 monitor 会通过如下地址将数据采集到 Prometheus 中。
|
||
|
||
|
||
|
||
### 应用部署配置
|
||
|
||
**1. 编写 DevOps 文件**
|
||
|
||
```groovy
|
||
pipeline {
|
||
agent {
|
||
node {
|
||
label 'maven'
|
||
}
|
||
}
|
||
options{
|
||
buildDiscarder(logRotator(numToKeepStr: '10'))
|
||
}
|
||
parameters {
|
||
string(name:'APP_NAME',defaultValue: 'accounts-service',description:'应用名称 必须使用小写 需跟maven构建中一致')
|
||
string(name:'PROJECT_NAMESPACE',defaultValue: 'basebiz',description:'部署项目集名称')
|
||
string(name:'SERVICE_SRC_PATH',defaultValue: 'accounts-service-webapp',description:'war包路径')
|
||
string(name:'PROGECT_GIT_PATH',defaultValue:'basebiz/accounts-service.git',description:'项目gitlabpath ')
|
||
string(name:'TAG_NAME',defaultValue: '',description:'tag 发布线上必须填写 格式v20210101(v+当前日期)')
|
||
string(name:'PODCOUNT',defaultValue: '2',description:'部署pod数量')
|
||
string(name:'HEALTH_CHECK_URI',defaultValue: '/api/actuator/health',description:'健康检测地址')
|
||
}
|
||
environment {
|
||
//构建镜像
|
||
REGISTRY = 'hub.xxxx.cn'
|
||
DOCKERHUB_NAMESPACE = 'app'
|
||
DOCKER_CREDENTIAL_ID = 'dockerhub-account' //hub账号密钥
|
||
GITHUB_CREDENTIAL_ID = 'gitlab-account' //gitlab账号密钥
|
||
//环境部署凭证
|
||
KUBECONFIG_CREDENTIAL_ID_DEV = 'testing-kubeconfig'
|
||
KUBECONFIG_CREDENTIAL_ID_VIEW = 'xxxxaliyun-testing'
|
||
KUBECONFIG_CREDENTIAL_ID_PROD = 'xxx-prod'
|
||
DOWNLOAD_BASEDOMAIN = 'gitlab.xxxx.cn' //公共资源下载
|
||
COMMIT_ID= sh( returnStdout: true, script: 'git rev-parse --short HEAD').trim()
|
||
|
||
}
|
||
stages {
|
||
stage ('迁出代码') {
|
||
steps {
|
||
checkout(scm)
|
||
}
|
||
}
|
||
stage ('编译') {
|
||
steps {
|
||
container ('maven') {
|
||
|
||
//***************************************
|
||
//**************下载通用模版***************
|
||
sh 'curl -o `pwd`/start.sh https://${DOWNLOAD_BASEDOMAIN}/base/basicevn/-/raw/master/shell/springboot-start.sh'
|
||
sh 'curl -o `pwd`/settings.xml https://${DOWNLOAD_BASEDOMAIN}/base/basicevn/-/raw/master/setting.xml'
|
||
sh 'curl -o `pwd`/Dockerfile https://${DOWNLOAD_BASEDOMAIN}/base/basicevn/-/raw/master/dockerfile/javaservice/dockerfile'
|
||
//***************************************
|
||
sh 'mkdir `pwd`/yaml'
|
||
sh 'curl -o `pwd`/yaml/devops-java.yaml https://${DOWNLOAD_BASEDOMAIN}/base/basicevn/-/raw/master/yaml/java-service-v1.0.0.yaml'
|
||
sh 'mvn -Dmaven.test.skip=true -gs `pwd`/settings.xml clean package -U -Denv.trackerror=true'
|
||
}
|
||
}
|
||
}
|
||
|
||
stage('构建并推送镜像'){
|
||
steps{
|
||
container ('maven') {
|
||
sh 'docker build --build-arg SERVICE_SRC_PATH=$SERVICE_SRC_PATH \
|
||
--build-arg GENERATE_PATH=generated-resources/appassembler/jsw/$APP_NAME \
|
||
--build-arg RELEASE_NAME=$BRANCH_NAME-$BUILD_NUMBER \
|
||
--build-arg APP_NAME=$APP_NAME \
|
||
-f Dockerfile \
|
||
-t $REGISTRY/$DOCKERHUB_NAMESPACE/$APP_NAME:$BRANCH_NAME-$TAG_NAME-$BUILD_NUMBER-$COMMIT_ID \
|
||
--no-cache .'
|
||
withCredentials([usernamePassword(passwordVariable : 'DOCKER_PASSWORD' ,usernameVariable : 'DOCKER_USERNAME' ,credentialsId : "$DOCKER_CREDENTIAL_ID" ,)]) {
|
||
sh 'echo "$DOCKER_PASSWORD" | docker login $REGISTRY -u "$DOCKER_USERNAME" --password-stdin'
|
||
sh 'docker push $REGISTRY/$DOCKERHUB_NAMESPACE/$APP_NAME:$BRANCH_NAME-$TAG_NAME-$BUILD_NUMBER-$COMMIT_ID'
|
||
}
|
||
sh 'docker tag $REGISTRY/$DOCKERHUB_NAMESPACE/$APP_NAME:$BRANCH_NAME-$TAG_NAME-$BUILD_NUMBER-$COMMIT_ID $REGISTRY/$DOCKERHUB_NAMESPACE/$APP_NAME:latest '
|
||
sh 'docker push $REGISTRY/$DOCKERHUB_NAMESPACE/$APP_NAME:latest '
|
||
}
|
||
}
|
||
}
|
||
stage("gitlab 打 tag"){
|
||
when{
|
||
expression{
|
||
return params.TAG_NAME =~ /v.*/
|
||
}
|
||
}
|
||
steps {
|
||
withCredentials([usernamePassword(credentialsId: "$GITHUB_CREDENTIAL_ID", passwordVariable: 'GIT_PASSWORD', usernameVariable: 'GIT_USERNAME')]) {
|
||
sh 'git config --global user.email "xxxx@xxxx.cn" '
|
||
sh 'git config --global user.name "xxxx" '
|
||
sh 'git tag -a $TAG_NAME-$BUILD_NUMBER -m "$TAG_NAME" '
|
||
sh 'git push https://$GIT_USERNAME:$GIT_PASSWORD@$DOWNLOAD_BASEDOMAIN/$PROGECT_GIT_PATH --tags --ipv4'
|
||
}
|
||
}
|
||
}
|
||
|
||
stage('部署测试环境') {
|
||
// when{
|
||
// branch 'master'
|
||
// }
|
||
steps {
|
||
//input(id: 'deploy-to-dev', message: 'deploy to dev?')
|
||
kubernetesDeploy(configs: 'yaml/**', enableConfigSubstitution: true, kubeconfigId: "$KUBECONFIG_CREDENTIAL_ID_DEV")
|
||
}
|
||
}
|
||
|
||
stage('部署生产环境') {
|
||
when{
|
||
expression{
|
||
return params.TAG_NAME =~ /v.*/
|
||
}
|
||
}
|
||
steps {
|
||
input(id: 'deploy-to-prod', message: '是否允许发布生产?')
|
||
kubernetesDeploy(configs: 'yaml/**', enableConfigSubstitution: true, kubeconfigId: "$KUBECONFIG_CREDENTIAL_ID_PROD")
|
||
}
|
||
}
|
||
}
|
||
}
|
||
|
||
```
|
||
|
||
Jenkinsfile 文件描述了如下几个过程:
|
||
|
||
* 下载通用模版文件(maven setting、部署的 yaml 文件,构建容器镜像的 Dockerfile)
|
||
* 使用 Maven 编译 Java 应用程序
|
||
* 将编译后的 Java 应用程序打包为 Docker 镜像
|
||
* 将构建好的 Docker 镜像推送到私有 DockerHub 中
|
||
* 将容器镜像部署到各个环境中
|
||
|
||
界面执行效果为:
|
||
|
||

|
||
|
||
**2. 编写部署的 yaml 文件**
|
||
|
||
```yaml
|
||
# java deployment基本配置
|
||
apiVersion: apps/v1
|
||
kind: Deployment
|
||
metadata:
|
||
labels:
|
||
app: $APP_NAME
|
||
component: ${PROJECT_NAMESPACE}-${APP_NAME}
|
||
release: java-actuator-prometheus
|
||
tier: backend
|
||
name: ${PROJECT_NAMESPACE}-${APP_NAME}
|
||
namespace: ${PROJECT_NAMESPACE}
|
||
spec:
|
||
progressDeadlineSeconds: 600
|
||
replicas: ${PODCOUNT}
|
||
selector:
|
||
matchLabels:
|
||
app: $APP_NAME
|
||
component: ${PROJECT_NAMESPACE}-${APP_NAME}
|
||
tier: backend
|
||
template:
|
||
metadata:
|
||
labels:
|
||
app: $APP_NAME
|
||
component: ${PROJECT_NAMESPACE}-${APP_NAME}
|
||
tier: backend
|
||
release: java-actuator-prometheus
|
||
annotations:
|
||
prometheus.io/path: /api/actuator/prometheus
|
||
prometheus.io/port: '8090'
|
||
prometheus.io/scrape: 'true'
|
||
spec:
|
||
volumes:
|
||
- name: base-config
|
||
configMap:
|
||
name: base-config
|
||
items:
|
||
- key: server.properties
|
||
path: server.properties
|
||
defaultMode: 420
|
||
- name: logconfig
|
||
configMap:
|
||
name: logconfig
|
||
items:
|
||
- key: logging-config.xml
|
||
path: logging-config.xml
|
||
defaultMode: 420
|
||
containers:
|
||
- env:
|
||
- name: HOST_IP
|
||
valueFrom:
|
||
fieldRef:
|
||
apiVersion: v1
|
||
fieldPath: status.hostIP
|
||
- name: DEPLOY_ENV
|
||
valueFrom:
|
||
configMapKeyRef:
|
||
name: base-config
|
||
key: env
|
||
- name: NACOS_SERVER
|
||
valueFrom:
|
||
configMapKeyRef:
|
||
name: base-config
|
||
key: nacos-server
|
||
- name: DB_SERVER_ADDRESS
|
||
valueFrom:
|
||
configMapKeyRef:
|
||
name: base-config
|
||
key: DB_SERVER_ADDRESS
|
||
image: $REGISTRY/$DOCKERHUB_NAMESPACE/$APP_NAME:$BRANCH_NAME-$TAG_NAME-$BUILD_NUMBER-$COMMIT_ID
|
||
readinessProbe:
|
||
httpGet:
|
||
path: ${HEALTH_CHECK_URI}
|
||
port: 8090
|
||
initialDelaySeconds: 30
|
||
timeoutSeconds: 10
|
||
failureThreshold: 30
|
||
periodSeconds: 5
|
||
imagePullPolicy: Always
|
||
name: ${PROJECT_NAMESPACE}-${APP_NAME}
|
||
ports:
|
||
- containerPort: 8080
|
||
protocol: TCP
|
||
- containerPort: 8090
|
||
protocol: TCP
|
||
resources:
|
||
limits:
|
||
cpu: 2000m
|
||
memory: 600Mi
|
||
requests:
|
||
cpu: 1m
|
||
memory: 100Mi
|
||
terminationMessagePath: /dev/termination-log
|
||
terminationMessagePolicy: File
|
||
dnsPolicy: ClusterFirst
|
||
restartPolicy: Always
|
||
terminationGracePeriodSeconds: 30
|
||
|
||
|
||
---
|
||
# 服务svc配置信息
|
||
apiVersion: v1
|
||
kind: Service
|
||
metadata:
|
||
labels:
|
||
app: ${APP_NAME}
|
||
component: ${PROJECT_NAMESPACE}-${APP_NAME}
|
||
release: java-actuator-prometheus
|
||
name: ${PROJECT_NAMESPACE}-${APP_NAME}
|
||
namespace: ${PROJECT_NAMESPACE}
|
||
annotations:
|
||
prometheus.io/path: /api/actuator/prometheus
|
||
prometheus.io/port: '8090'
|
||
prometheus.io/scrape: 'true'
|
||
|
||
spec:
|
||
ports:
|
||
- name: http
|
||
port: 8080
|
||
protocol: TCP
|
||
targetPort: 8080
|
||
- name: http-actuator
|
||
port: 8090
|
||
protocol: TCP
|
||
targetPort: 8090
|
||
selector:
|
||
app: ${APP_NAME}
|
||
component: ${PROJECT_NAMESPACE}-${APP_NAME}
|
||
tier: backend
|
||
sessionAffinity: None
|
||
type: ClusterIP
|
||
|
||
```
|
||
|
||
通过如上的 yaml 我们会部署应用负载容器及服务 SVC。
|
||
|
||
我们在 Deployment 的 metadata 中进行了如下的描述 后期在部署 ServiceMonitor 的时候会使用到。
|
||
|
||

|
||
|
||
## 在 Kubernetes 中部署 ServiceMonitor
|
||
|
||
### 准备我们对应 Java 服务的 ServiceMonitor 部署文件
|
||
|
||
```yaml
|
||
apiVersion: monitoring.coreos.com/v1
|
||
kind: ServiceMonitor
|
||
metadata:
|
||
labels:
|
||
app: java-actuator-prometheus
|
||
component: java-actuator-prometheus
|
||
heritage: Tiller
|
||
release: prometh-java-actuator
|
||
name: monitor-java-actuator-prometheus
|
||
namespace: default
|
||
spec:
|
||
endpoints:
|
||
- honorLabels: true
|
||
interval: 5s
|
||
path: /api/actuator/prometheus
|
||
port: http
|
||
jobLabel: java-actuator-prometheus
|
||
namespaceSelector:
|
||
any: true
|
||
selector:
|
||
matchLabels:
|
||
release: java-actuator-prometheus
|
||
|
||
```
|
||
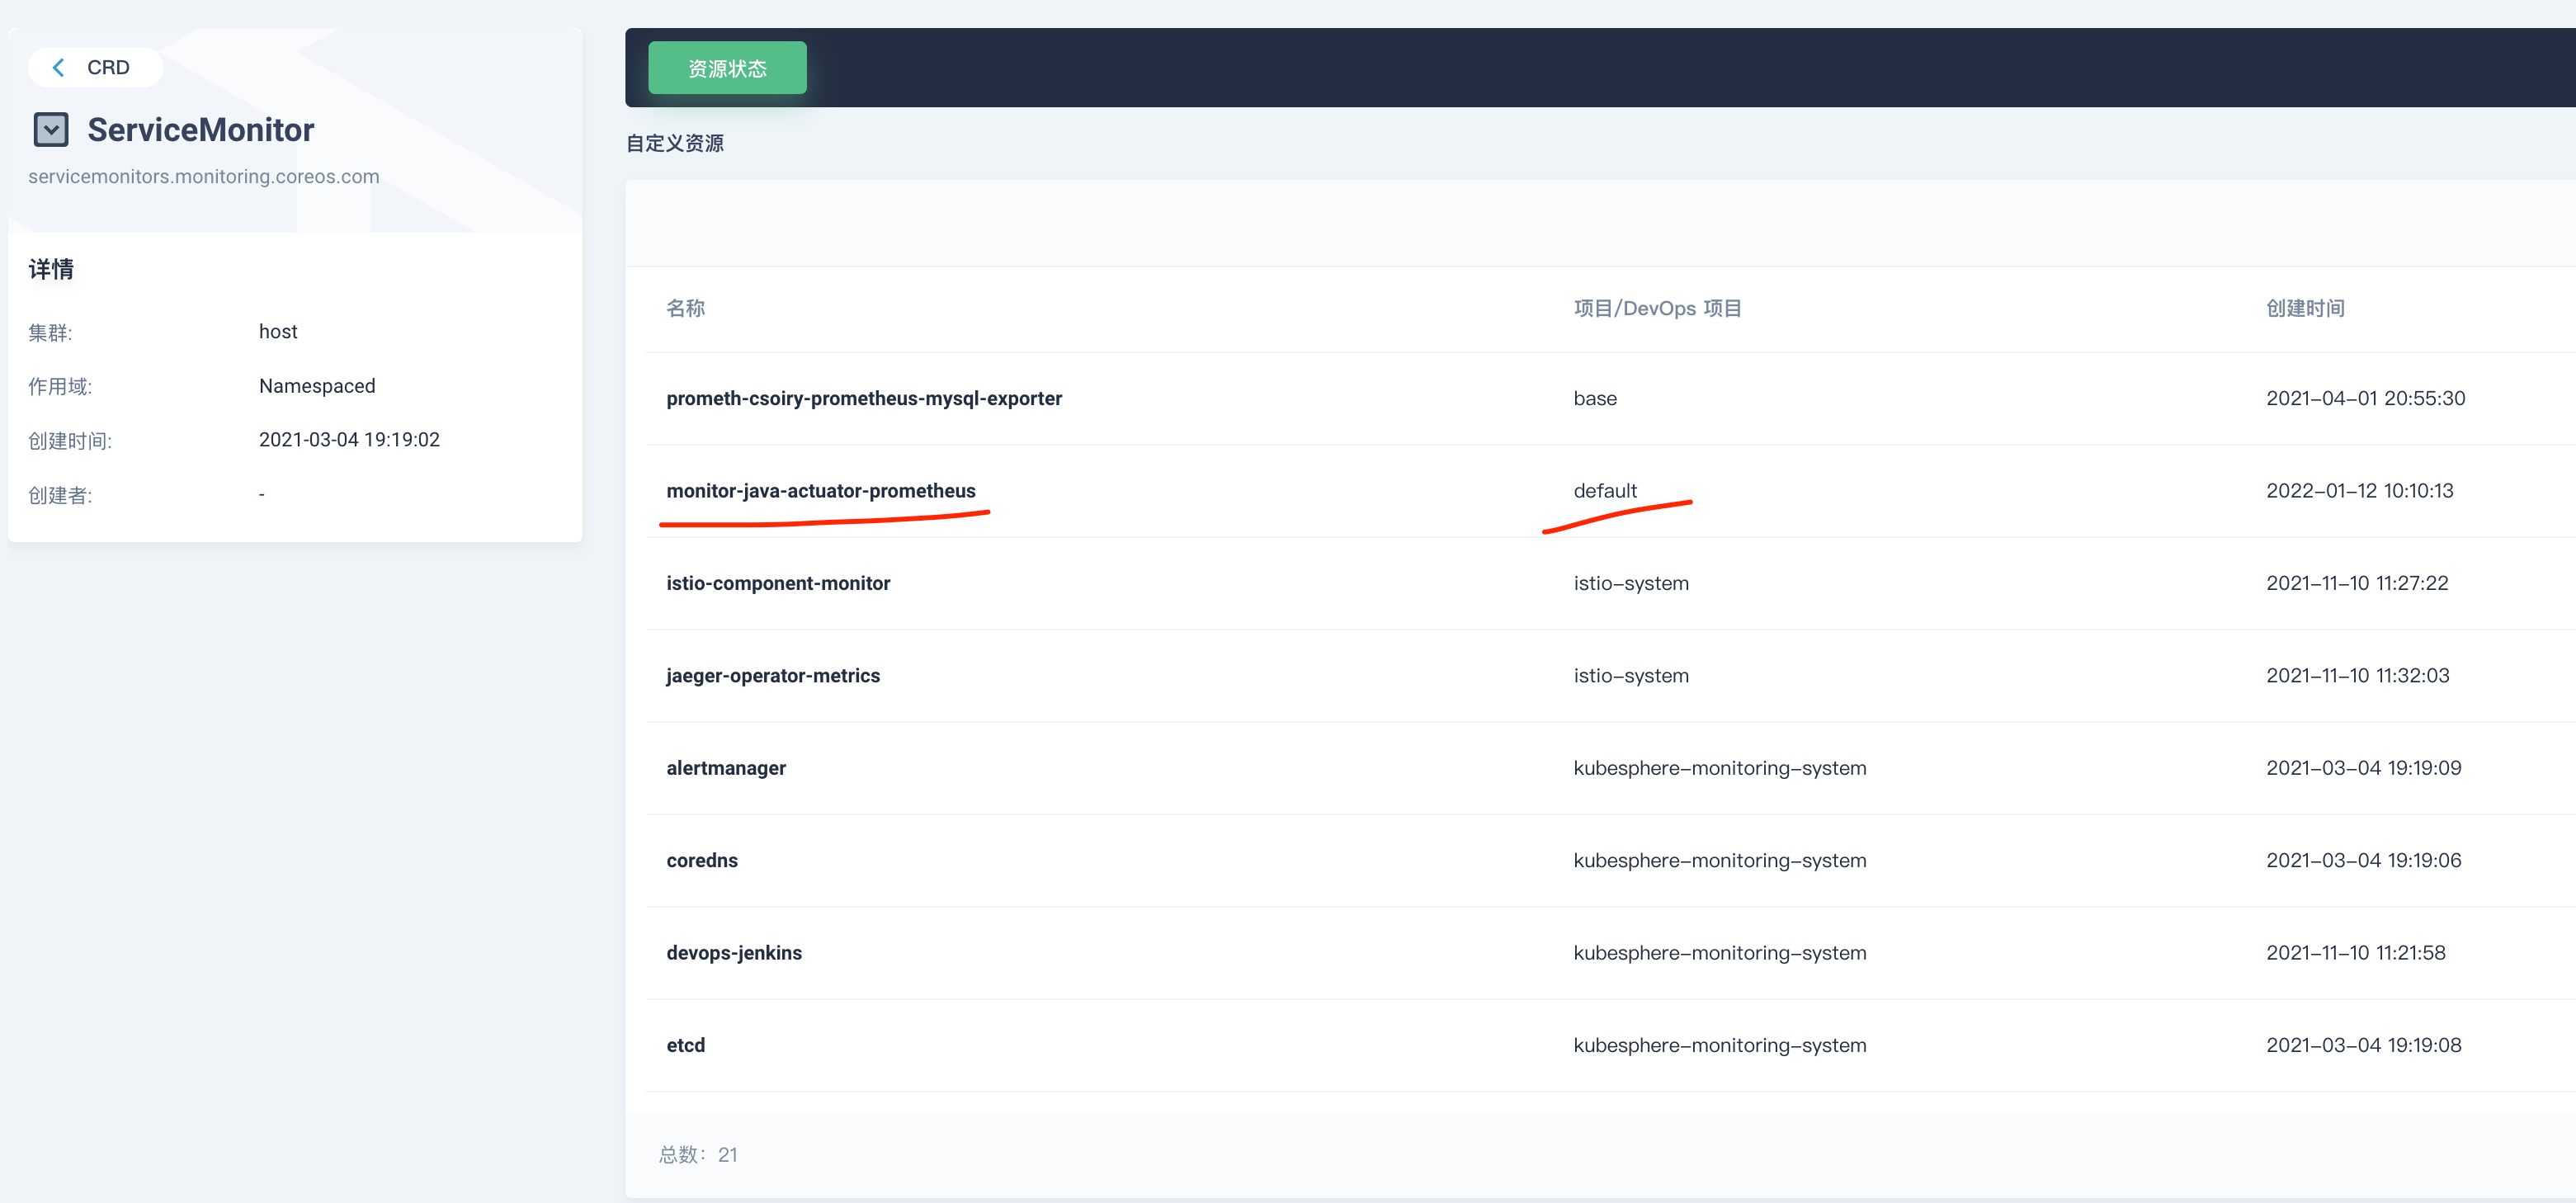
yaml 描述了我们将采集什么 namespace 下面的数据,在这里我们将 namespace 设置为了 default, 将采集所有 namespace 下面的数据,同时我们将 selector 下的 release:xx 设置成了与我们部署的微服务的 metadata 的 release 一致,那么 ServiceMonitor 将采集到所有 namespace 下面标注了 release 为 java-actuator-prometheus 的所有服务的数据。
|
||
|
||
### 将 ServiceMonitor 部署到集群中
|
||
|
||
我们可以通过 kubectl apply 将其部署到集群中。
|
||
|
||
```yaml
|
||
kubectl apply -f - <<EOF
|
||
apiVersion: monitoring.coreos.com/v1
|
||
kind: ServiceMonitor
|
||
metadata:
|
||
labels:
|
||
app: java-actuator-prometheus
|
||
component: java-actuator-prometheus
|
||
heritage: Tiller
|
||
release: prometh-java-actuator
|
||
name: monitor-java-actuator-prometheus
|
||
namespace: default
|
||
spec:
|
||
endpoints:
|
||
- honorLabels: true
|
||
interval: 5s
|
||
path: /api/actuator/prometheus
|
||
port: http
|
||
jobLabel: java-actuator-prometheus
|
||
namespaceSelector:
|
||
any: true
|
||
selector:
|
||
matchLabels:
|
||
release: java-actuator-prometheus
|
||
EOF
|
||
```
|
||
|
||
执行成功后我们可以在集群的 CRD 下面搜索 ServiceMonitor 并打开可以找到我们部署的 ServiceMonitor 配置。如图所示:
|
||
|
||
|
||
|
||
当然你也可以通过命令行进行查询验证。
|
||
|
||
## 验证数据采集并配置 Grafana
|
||
|
||
### 查看系统 Prometheus 地址并查询数据
|
||
|
||
**我们可以在集群中的如下地址找到 KubeSphere 系统集成的 Prometheus 服务,如图所示**
|
||
|
||

|
||
|
||
访问 Prometheus Web 界面。
|
||
|
||
通过 3.1.1 我们可以看到普罗米修斯服务的 ip 地址为 172.17.107.29,默认端口为 9090。我们在浏览器输入 http://172.17.107.29:9090,可以看到如图所示:
|
||
|
||

|
||
|
||
### 在 KubeSphere 中配置自定义监控及告警
|
||
|
||
**1. 自定义监控**
|
||
|
||
我们可以访问-集群-> 监控告警-> 自定义监控进入,如图所示:
|
||
|
||

|
||
|
||
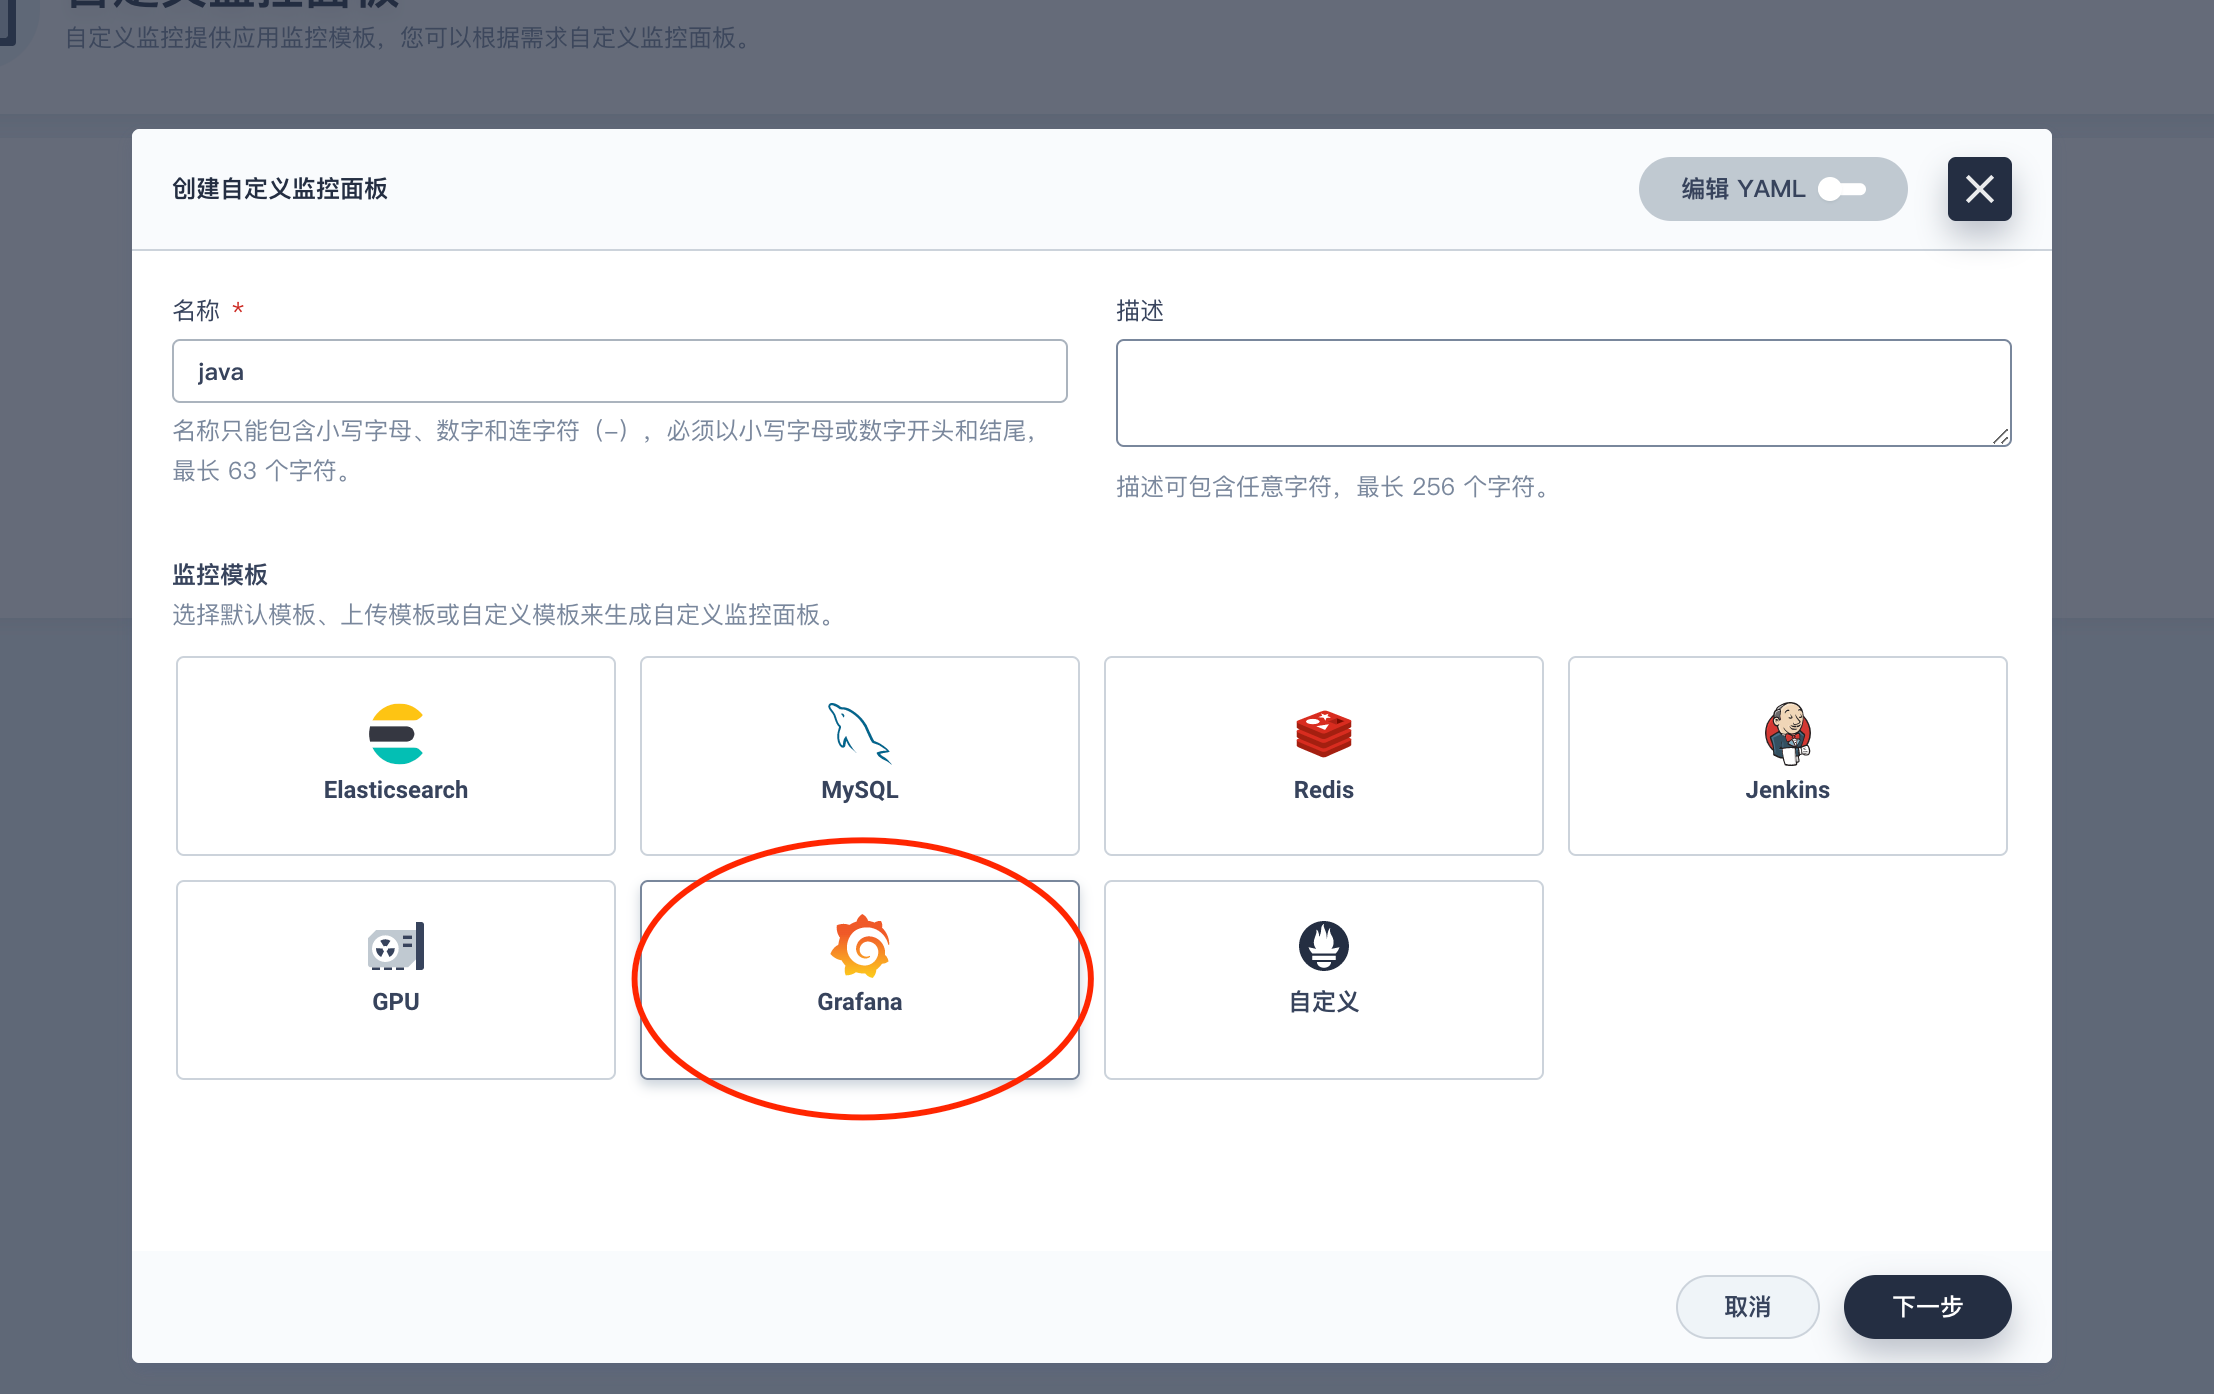
我们点击创建 可以看到 KubeSphere 已经集成了部分监控面板,这里我们选择 Grafana。
|
||
|
||
|
||
|
||
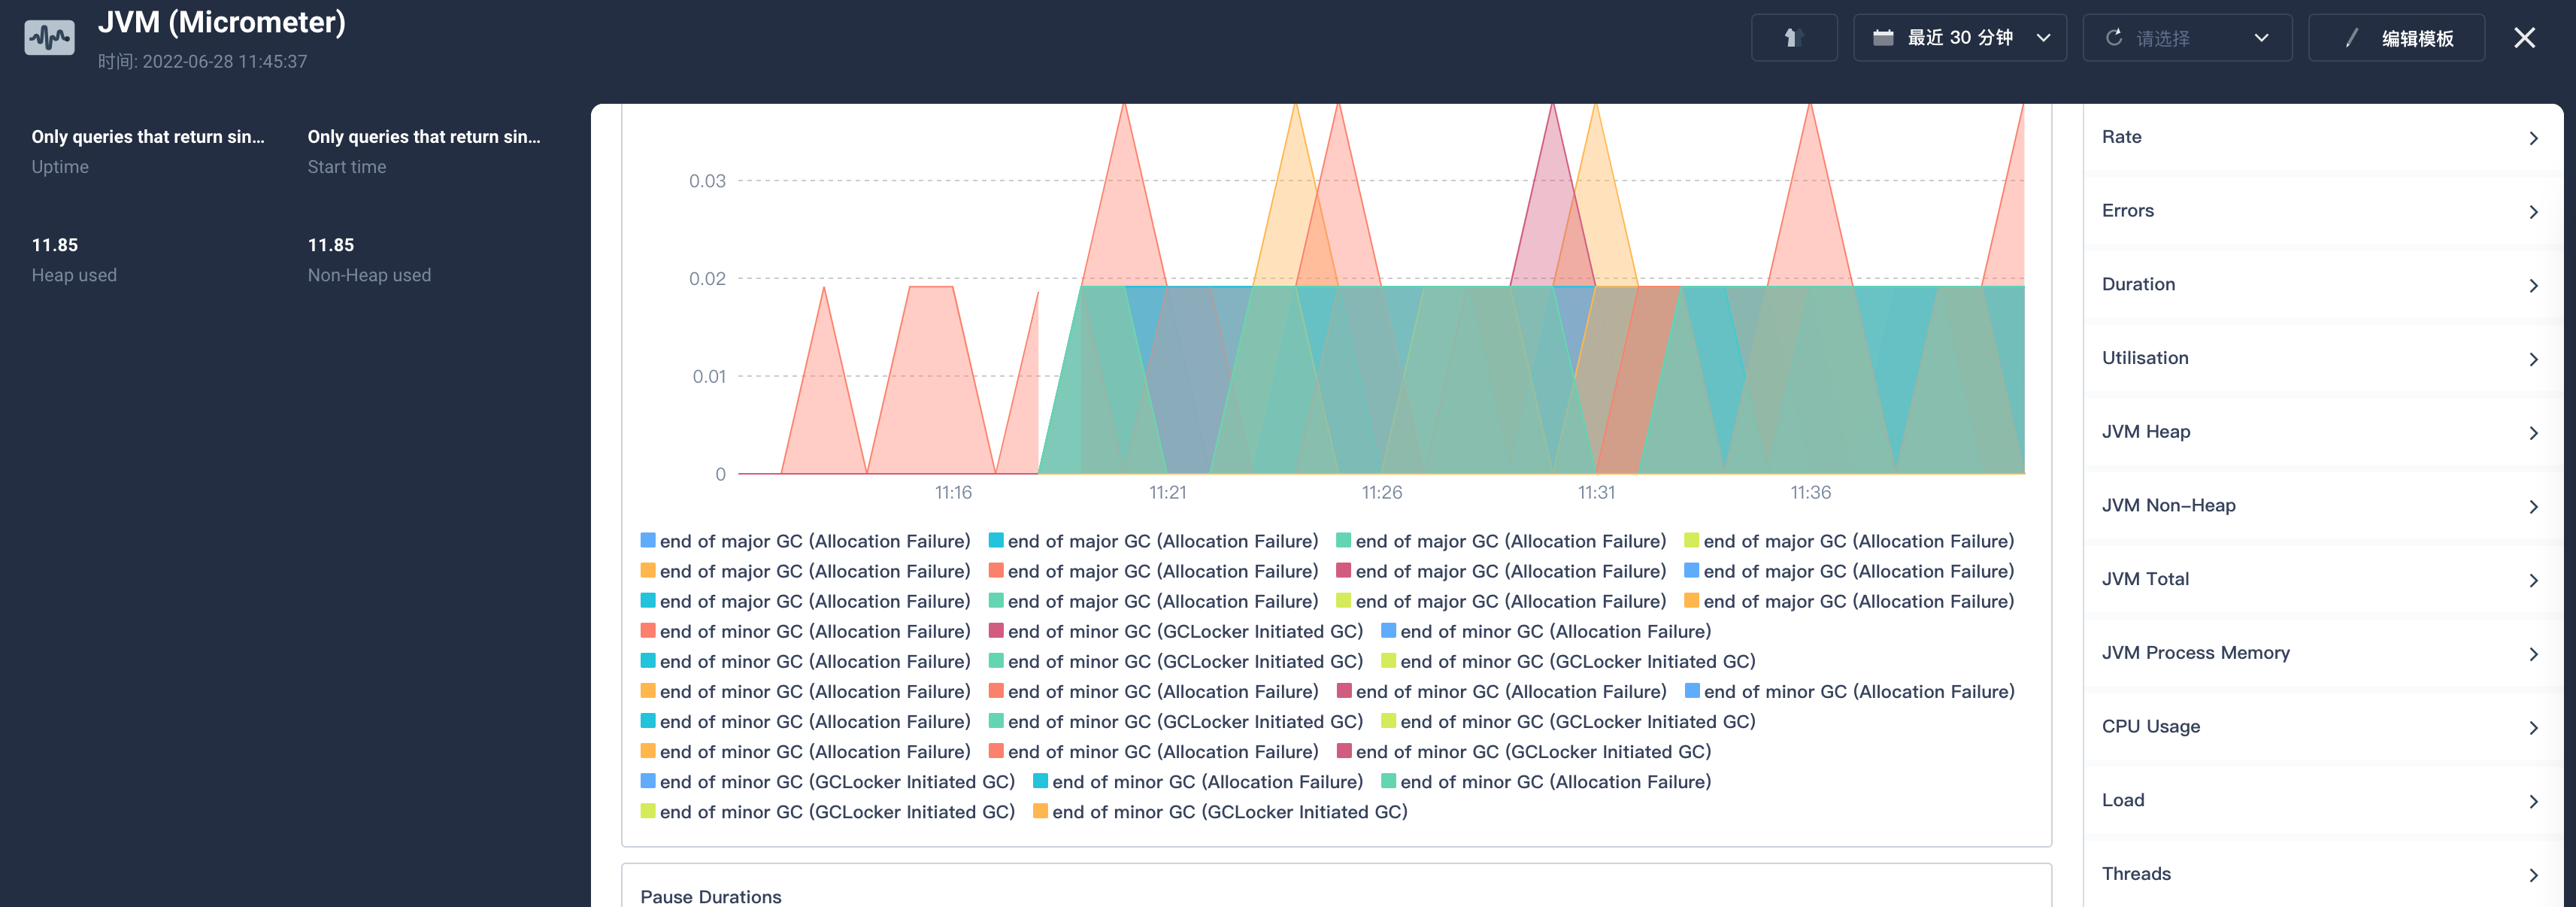
在下一步后系统会让我们上传 JSON 模版,我们可以通过 [Grafana 官网](https://grafana.com/grafana/dashboards)下载一些通用的模版配置,这里我们使用的是 [JVM (Micrometer)](https://grafana.com/grafana/dashboards/4701)。在右侧可以下载 JSON 文件。
|
||
|
||
导入后我们就可以看到相关监控指标了。
|
||
|
||
|
||
|
||
**2. 自定义告警**
|
||
|
||
我们也可以使用系统集成的告警策略设置基于采集数据的自定义告警设置。例如:
|
||
|
||

|
||
|
||
### 使用外置的 Grafana
|
||
|
||
1. 安装 Grafana
|
||
|
||
- 配置应用仓库
|
||
- 为了快速的安装 Helm 应用 我们可以依次打开企业空间-应用管理-应用仓库;
|
||
- 在点击右边的添加按钮这里 我们添加的是 bitmap 的应用仓库地址:https://charts.bitnami.com/bitnami;
|
||
- 添加完成后稍等片刻应用列表就加载完毕。
|
||
- 安装 grafana 应用
|
||
- 我们依次打开企业空间-项目-点击要安装到的具体项目-点击应用-点击右侧的创建按钮;
|
||
- 弹出对话框中点击从应用模版,从应用仓库列表中选择我们刚刚添加的 bitnami 的仓库,搜索 Grafana 点击后安装即可。
|
||
|
||

|
||
|
||
2. Grafana 数据源
|
||
|
||
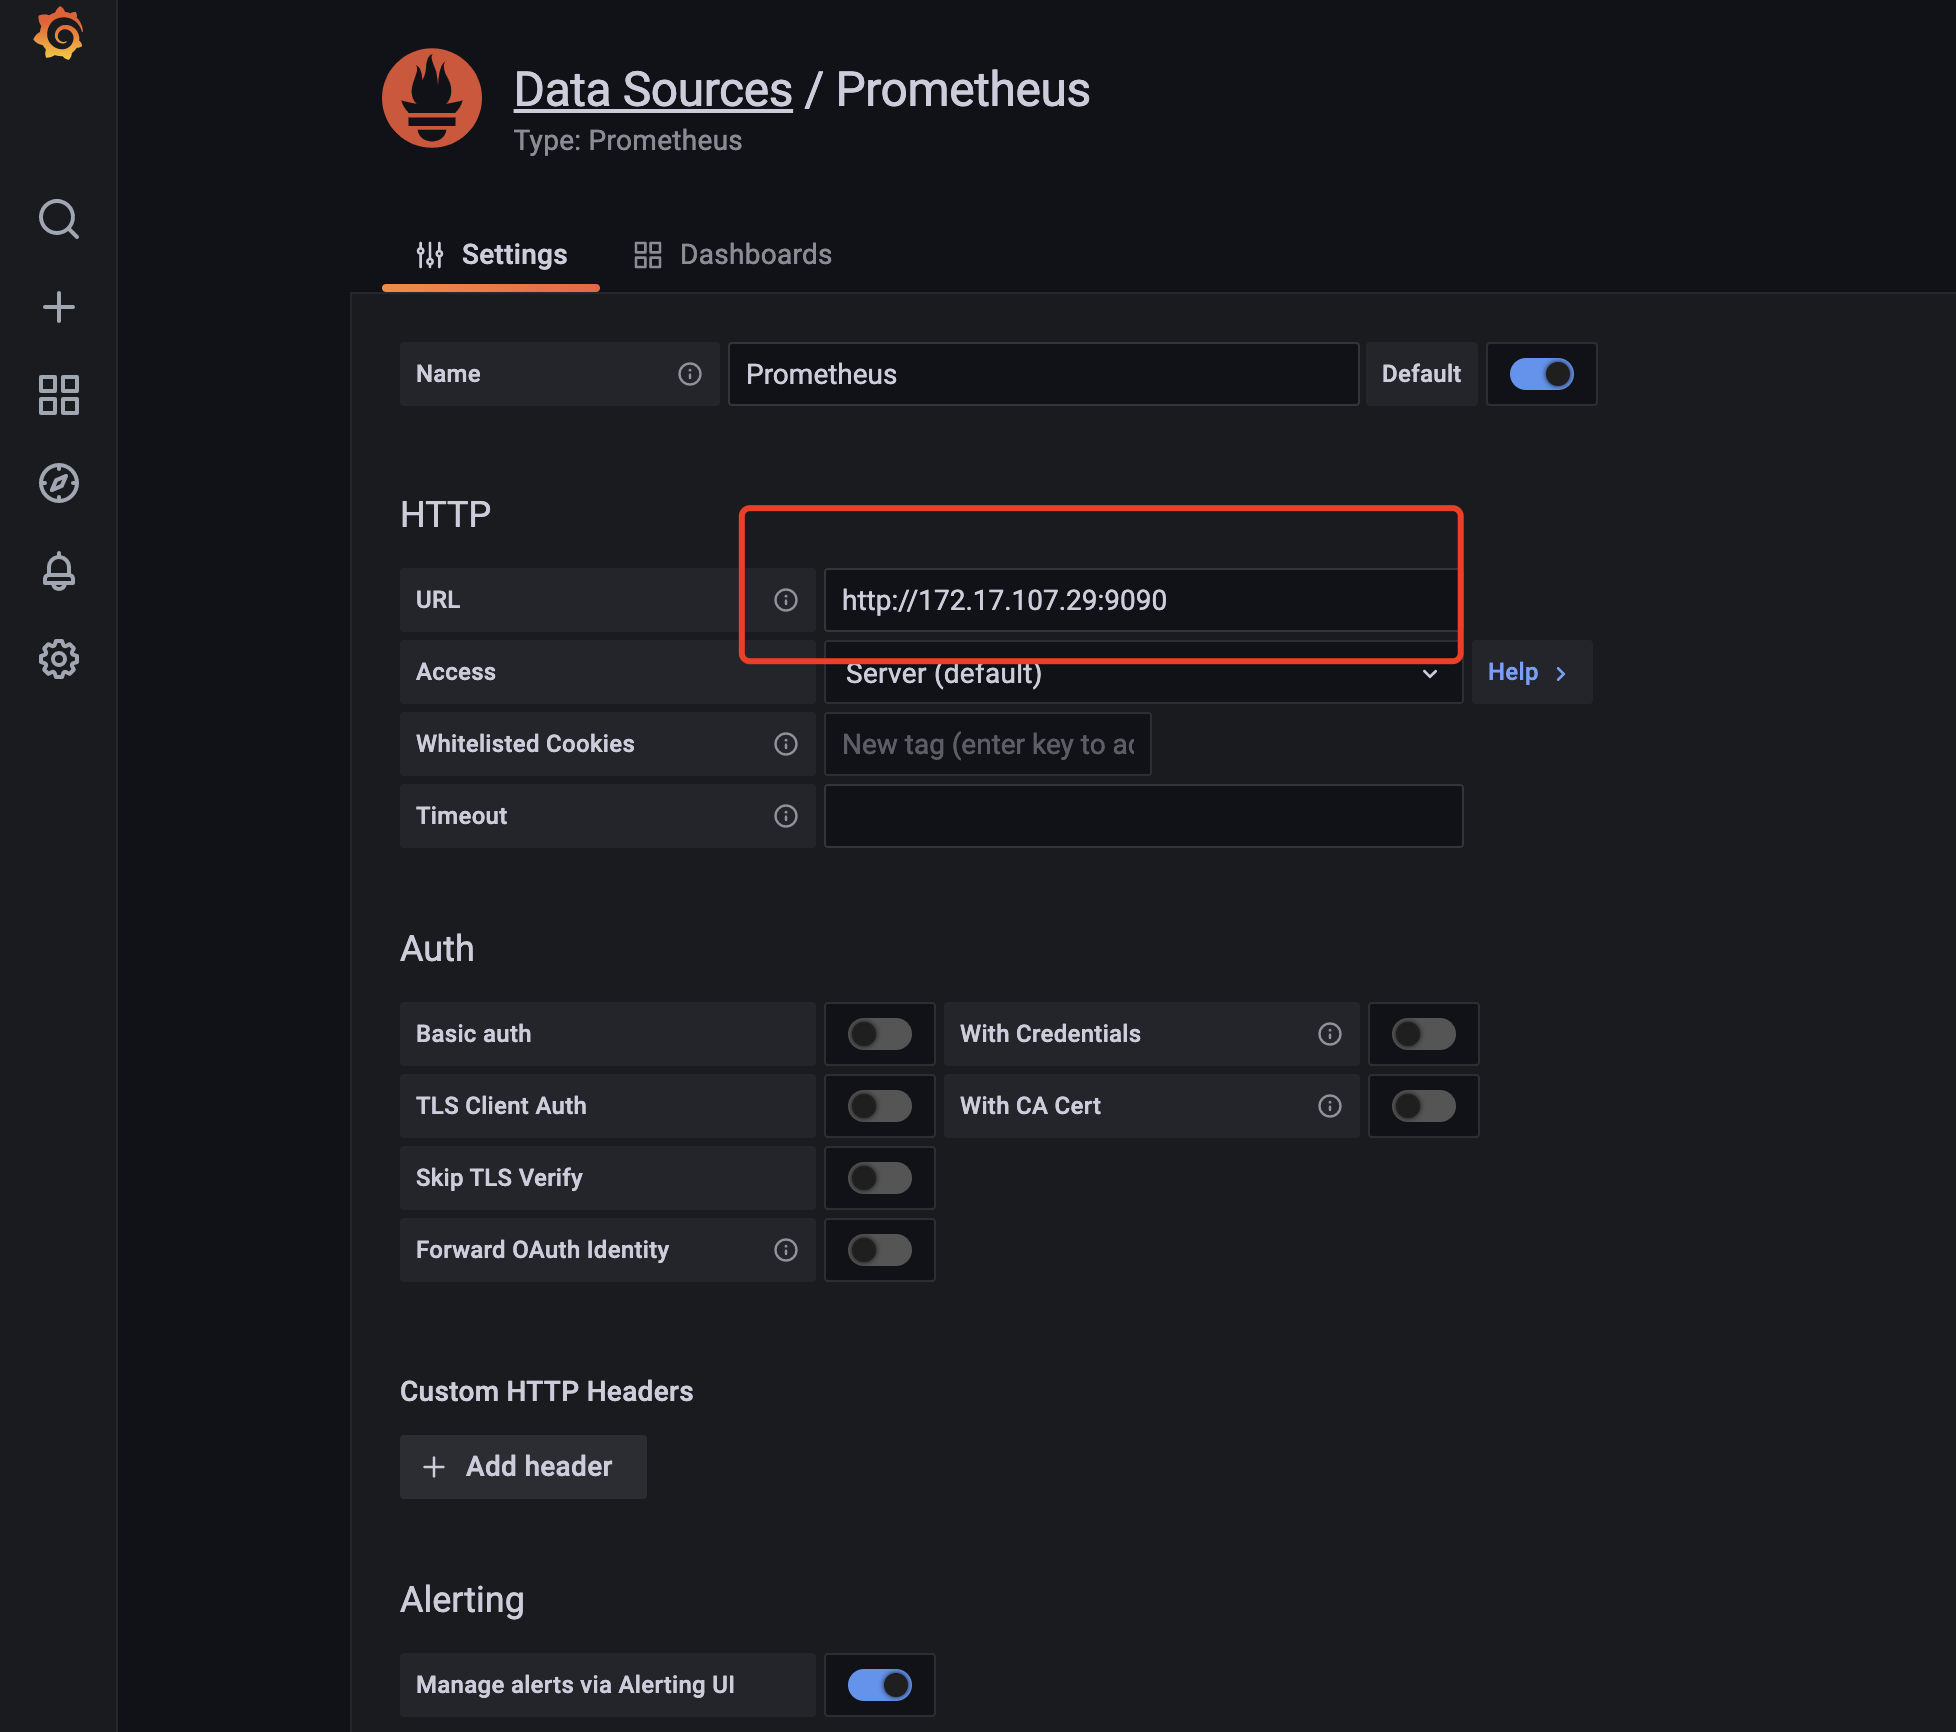
- 我们使用管理员账号登录进 Grafana,默认密码可以在项目的保密字典中的 grafana-admin 中找到;
|
||
- 登录后我们点击左侧的小齿轮-datasource 在打开页面中选择 Add data source 然后选择 Prometheus 在 URL 中填入我们上面说到的 Prometheus 的 URL 地址。如图所示:
|
||
|
||
- 填写后拖到最下面,点击 save&test。
|
||
|
||
3. 导入 Dashbord
|
||
|
||
- 我们点击页面左侧➕-import;
|
||
- 输入我们从 [grafana 官网](https://grafana.com/grafana/dashboards) 获得的对应的模版的 id 点击 load;
|
||
- 在下一步中选择 Prometheus 为我们配置的数据源 点击 import 即可。
|
||
|
||
 |