mirror of
https://github.com/kubesphere/website.git
synced 2025-12-26 00:12:48 +00:00
566 lines
23 KiB
Markdown
566 lines
23 KiB
Markdown
---
|
||
title: '使用 GPU-Operator 与 KubeSphere 简化深度学习训练与监控 GPU'
|
||
tag: 'KubeSphere,Kubernetes,GPU,深度学习'
|
||
keywords: 'GPU, Operator, GPU-Operator, NVIDIA, k8s-device-plugin, 深度学习, Kubernetes, KubeSphere'
|
||
description: '本文将从 GPU-Operator 概念介绍、安装部署、深度训练测试应用部署,以及在 KubeSphere 使用自定义监控面板对接 GPU 监控,从原理到实践,逐步浅析介绍与实践 GPU-Operator。'
|
||
createTime: '2021-03-17'
|
||
author: '朱含'
|
||
snapshot: 'https://pek3b.qingstor.com/kubesphere-community/images/fengmian.png'
|
||
---
|
||
|
||
本文将从 GPU-Operator 概念介绍、安装部署、深度训练测试应用部署,以及在 KubeSphere 使用自定义监控面板对接 GPU 监控,从原理到实践,逐步浅析介绍与实践 GPU-Operator。
|
||
|
||
## GPU-Operator简介
|
||
|
||
众所周知,Kubernetes 平台通过设备插件框架提供对特殊硬件资源的访问,如 NVIDIA GPU、网卡、Infiniband 适配器和其他设备。然而,使用这些硬件资源配置和管理节点需要配置多个软件组件,如驱动程序、容器运行时或其他依赖库,这是比较困难的和容易出错的。
|
||
|
||
NVIDIA GPU Operator 由 Nvidia 公司开源,利用了 Kubernetes 的 Operator 控制模式,方便地自动化集成管理 GPU 所需的 NVIDIA 设备组件,有效地解决了上述GPU设备集成的痛点。这些组件包括 NVIDIA 驱动程序(用于启用 CUDA )、用于 GPU 的 Kubernetes 设备插件、NVIDIA Container 运行时、自动节点标签、基于 DCGM 的监控等。
|
||
|
||
NVIDIA GPU Operator 的不仅实现了设备和组件一体化集成,而且它管理 GPU 节点就像管理 CPU 节点一样方便,无需单独为 GPU 节点提供特殊的操作系统。值得关注的是,它将 GPU 各组件容器化,提供 GPU 能力,非常适合快速扩展和管理规模 GPU 节点。当然,对于已经为 GPU 组件构建了特殊操作系统的应用场景来说,显得并不是那么合适了。
|
||
|
||
### GPU-Operator 架构原理
|
||
|
||
前文提到,NVIDIA GPU Operator 管理 GPU 节点就像管理 CPU 节点一样方便,那么它是如何实现这一能力呢?
|
||
|
||
我们一起来看看 GPU-Operator 运行时的架构图:
|
||
|
||

|
||
|
||
通过图中的描述,我们可以知道, GPU-Operator 是通过实现了 Nvidia 容器运行时,以`runC`作为输入,在`runC`中`preStart hook`中注入了一个名叫`nvidia-container-toolkit`的脚本,该脚本调用`libnvidia-container CLI`设置一系列合适的`flags`,使得容器运行后具有 GPU 能力。
|
||
|
||
## GPU-Operator 安装说明
|
||
|
||
### 前提条件
|
||
|
||
在安装 GPU Operator 之前,请配置好安装环境如下:
|
||
|
||
* 所有节点**不需要**预先安装NVIDIA组件(`driver`,`container runtime`,`device plugin`);
|
||
* 所有节点必须配置`Docker`,`cri-o`, 或者`containerd`.对于 docker 来说,可以参考[这里](https://docs.docker.com/engine/install/);
|
||
* 如果使用HWE内核(e.g. kernel 5.x) 的 Ubuntu 18.04 LTS 环境下,需要给`nouveau driver`添加黑名单,需要更新`initramfs`;
|
||
|
||
```plain
|
||
$ sudo vim /etc/modprobe.d/blacklist.conf # 在尾部添加黑名单
|
||
blacklist nouveau
|
||
options nouveau modeset=0
|
||
$ sudo update-initramfs -u
|
||
$ reboot
|
||
$ lsmod | grep nouveau # 验证nouveau是否已禁用
|
||
$ cat /proc/cpuinfo | grep name | cut -f2 -d: | uniq -c #本文测试时处理器架构代号为Broadwell
|
||
16 Intel Core Processor (Broadwell)
|
||
```
|
||
|
||
* 节点发现(NFD) 需要在每个节点上配置,默认情况会直接安装,如果已经配置,请在`Helm chart`变量设置`nfd.enabled`为`false`, 再安装;
|
||
* 如果使用 Kubernetes 1.13和1.14, 需要激活 [KubeletPodResources](https://kubernetes.io/docs/reference/command-line-tools-reference/feature-gates/);
|
||
|
||
#### 支持的linux版本
|
||
|
||
| **OS Name / Version** | **Identifier** | **amd64 / x86_64** | **ppc64le** | **arm64 / aarch64** |
|
||
| :-------------------- | :------------- | :----------------- | :---------- | :------------------ |
|
||
| Amazon Linux 1 | amzn1 | X | | |
|
||
| Amazon Linux 2 | amzn2 | X | | |
|
||
| Amazon Linux 2017.09 | amzn2017.09 | X | | |
|
||
| Amazon Linux 2018.03 | amzn2018.03 | X | | |
|
||
| Open Suse Leap 15.0 | sles15.0 | X | | |
|
||
| Open Suse Leap 15.1 | sles15.1 | X | | |
|
||
| Debian Linux 9 | debian9 | X | | |
|
||
| Debian Linux 10 | debian10 | X | | |
|
||
| Centos 7 | centos7 | X | X | |
|
||
| Centos 8 | centos8 | X | X | X |
|
||
| RHEL 7.4 | rhel7.4 | X | X | |
|
||
| RHEL 7.5 | rhel7.5 | X | X | |
|
||
| RHEL 7.6 | rhel7.6 | X | X | |
|
||
| RHEL 7.7 | rhel7.7 | X | X | |
|
||
| RHEL 8.0 | rhel8.0 | X | X | X |
|
||
| RHEL 8.1 | rhel8.1 | X | X | X |
|
||
| RHEL 8.2 | rhel8.2 | X | X | X |
|
||
| Ubuntu 16.04 | ubuntu16.04 | X | X | |
|
||
| Ubuntu 18.04 | ubuntu18.04 | X | X | X |
|
||
| Ubuntu 20.04 | ubuntu20.04 | X | X | X |
|
||
|
||
#### 支持的容器运行时
|
||
|
||
| **OS Name / Version** | **amd64 / x86_64** | **ppc64le** | **arm64 / aarch64** |
|
||
| :-------------------- | :----------------- | :---------- | :------------------ |
|
||
| Docker 18.09 | X | X | X |
|
||
| Docker 19.03 | X | X | X |
|
||
| RHEL/CentOS 8 podman | X | | |
|
||
| CentOS 8 Docker | X | | |
|
||
| RHEL/CentOS 7 Docker | X | | |
|
||
|
||
### 安装doker环境
|
||
|
||
可参考 [Docker 官方文档](https://docs.docker.com/engine/install/)
|
||
|
||
### 安装NVIDIA Docker
|
||
|
||
配置 stable 仓库和 GPG key :
|
||
|
||
```plain
|
||
$ distribution=$(. /etc/os-release;echo $ID$VERSION_ID) \
|
||
&& curl -s -L https://nvidia.github.io/nvidia-docker/gpgkey | sudo apt-key add - \
|
||
&& curl -s -L https://nvidia.github.io/nvidia-docker/$distribution/nvidia-docker.list | sudo tee /etc/apt/sources.list.d/nvidia-docker.list
|
||
```
|
||
|
||
更新软件仓库后安装`nvidia-docker2`并添加运行时配置:
|
||
|
||
```shell
|
||
$ sudo apt-get update
|
||
$ sudo apt-get install -y nvidia-docker2
|
||
-----
|
||
What would you like to do about it ? Your options are:
|
||
Y or I : install the package maintainer's version
|
||
N or O : keep your currently-installed version
|
||
D : show the differences between the versions
|
||
Z : start a shell to examine the situation
|
||
-----
|
||
# 初次安装,遇到以上交互式问题可选择N
|
||
# 如果选择Y会覆盖你的一些默认配置
|
||
# 选择N后,将以下配置添加到etc/docker/daemon.json
|
||
{
|
||
"runtimes": {
|
||
"nvidia": {
|
||
"path": "/usr/bin/nvidia-container-runtime",
|
||
"runtimeArgs": []
|
||
}
|
||
}
|
||
}
|
||
```
|
||
|
||
重启`docker`:
|
||
|
||
```plain
|
||
$ sudo systemctl restart docker
|
||
```
|
||
|
||
### 安装Helm
|
||
|
||
```plain
|
||
$ curl -fsSL -o get_helm.sh https://raw.githubusercontent.com/helm/helm/master/scripts/get-helm-3 \
|
||
&& chmod 700 get_helm.sh \
|
||
&& ./get_helm.sh
|
||
```
|
||
|
||
添加`helm`仓库
|
||
|
||
```plain
|
||
$ helm repo add nvidia https://nvidia.github.io/gpu-operator \
|
||
&& helm repo update
|
||
```
|
||
|
||
### 安装 NVIDIA GPU Operator
|
||
|
||
不同的容器运行时安装方法稍有区别:
|
||
|
||
#### docker as runtime
|
||
|
||
```plain
|
||
$ kubectl create ns gpu-operator-resources
|
||
$ helm install gpu-operator nvidia/gpu-operator -n gpu-operator-resources --wait
|
||
```
|
||
|
||
如果需要指定驱动版本,可参考如下:
|
||
|
||
```plain
|
||
$ helm install gpu-operator nvidia/gpu-operator -n gpu-operator-resources \
|
||
--set driver.version="450.80.02"
|
||
```
|
||
|
||
#### crio as runtime
|
||
|
||
```plain
|
||
helm install gpu-operator nvidia/gpu-operator -n gpu-operator-resources\
|
||
--set operator.defaultRuntime=crio
|
||
```
|
||
|
||
#### containerd as runtime
|
||
|
||
```plain
|
||
helm install gpu-operator nvidia/gpu-operator -n gpu-operator-resources\
|
||
--set operator.defaultRuntime=containerd
|
||
|
||
Furthermore, when setting containerd as the defaultRuntime the following options are also available:
|
||
toolkit:
|
||
env:
|
||
- name: CONTAINERD_CONFIG
|
||
value: /etc/containerd/config.toml
|
||
- name: CONTAINERD_SOCKET
|
||
value: /run/containerd/containerd.sock
|
||
- name: CONTAINERD_RUNTIME_CLASS
|
||
value: nvidia
|
||
- name: CONTAINERD_SET_AS_DEFAULT
|
||
value: true
|
||
```
|
||
|
||
**由于安装的镜像比较大,所以初次安装过程中可能会出现超时的情形,请检查你的镜像是否在拉取中!可以考虑使用[离线安装](https://docs.nvidia.com/datacenter/cloud-native/gpu-operator/getting-started.html#considerations-to-install-in-air-gapped-clusters)解决该类问题**
|
||
|
||
#### 使用 values.yaml 安装
|
||
|
||
```plain
|
||
$ helm install gpu-operator nvidia/gpu-operator -n gpu-operator-resources -f values.yaml
|
||
```
|
||
|
||
## 应用部署
|
||
|
||
### 检查已部署 Operator 服务状态
|
||
|
||
#### 检查 Pods 状态
|
||
|
||
```plain
|
||
$ kubectl get pods -n gpu-operator-resources
|
||
NAME READY STATUS RESTARTS AGE
|
||
gpu-feature-discovery-4gk78 1/1 Running 0 35s
|
||
gpu-operator-858fc55fdb-jv488 1/1 Running 0 2m52s
|
||
gpu-operator-node-feature-discovery-master-7f9ccc4c7b-2sg6r 1/1 Running 0 2m52s
|
||
gpu-operator-node-feature-discovery-worker-cbkhn 1/1 Running 0 2m52s
|
||
gpu-operator-node-feature-discovery-worker-m8jcm 1/1 Running 0 2m52s
|
||
nvidia-container-toolkit-daemonset-tfwqt 1/1 Running 0 2m42s
|
||
nvidia-dcgm-exporter-mqns5 1/1 Running 0 38s
|
||
nvidia-device-plugin-daemonset-7npbs 1/1 Running 0 53s
|
||
nvidia-device-plugin-validation 0/1 Completed 0 49s
|
||
nvidia-driver-daemonset-hgv6s
|
||
```
|
||
|
||
#### 检查节点资源是否处于可分配
|
||
|
||
```plain
|
||
$ kubectl describe node worker-gpu-001
|
||
---
|
||
Allocatable:
|
||
cpu: 15600m
|
||
ephemeral-storage: 82435528Ki
|
||
hugepages-2Mi: 0
|
||
memory: 63649242267
|
||
nvidia.com/gpu: 1 #check here
|
||
pods: 110
|
||
---
|
||
```
|
||
|
||
### 部署 Nvidia 文档的两个深度训练测试实例
|
||
|
||
#### 实例一
|
||
|
||
```plain
|
||
$ cat cuda-load-generator.yaml
|
||
apiVersion: v1
|
||
kind: Pod
|
||
metadata:
|
||
name: dcgmproftester
|
||
spec:
|
||
restartPolicy: OnFailure
|
||
containers:
|
||
- name: dcgmproftester11
|
||
image: nvidia/samples:dcgmproftester-2.0.10-cuda11.0-ubuntu18.04
|
||
args: ["--no-dcgm-validation", "-t 1004", "-d 120"]
|
||
resources:
|
||
limits:
|
||
nvidia.com/gpu: 1
|
||
securityContext:
|
||
capabilities:
|
||
add: ["SYS_ADMIN"]
|
||
EOF
|
||
```
|
||
|
||
#### 实例二
|
||
|
||
```plain
|
||
$ curl -LO https://nvidia.github.io/gpu-operator/notebook-example.yml
|
||
$ cat notebook-example.yml
|
||
apiVersion: v1
|
||
kind: Service
|
||
metadata:
|
||
name: tf-notebook
|
||
labels:
|
||
app: tf-notebook
|
||
spec:
|
||
type: NodePort
|
||
ports:
|
||
- port: 80
|
||
name: http
|
||
targetPort: 8888
|
||
nodePort: 30001
|
||
selector:
|
||
app: tf-notebook
|
||
---
|
||
apiVersion: v1
|
||
kind: Pod
|
||
metadata:
|
||
name: tf-notebook
|
||
labels:
|
||
app: tf-notebook
|
||
spec:
|
||
securityContext:
|
||
fsGroup: 0
|
||
containers:
|
||
- name: tf-notebook
|
||
image: tensorflow/tensorflow:latest-gpu-jupyter
|
||
resources:
|
||
limits:
|
||
nvidia.com/gpu: 1
|
||
ports:
|
||
- containerPort: 8
|
||
```
|
||
|
||
### 基于 Jupyter Notebook 应用运行深度学习训练任务
|
||
|
||
#### 部署 cuda 与 notebook 示例应用
|
||
|
||
```plain
|
||
$ kubectl apply -f cuda-load-generator.yaml
|
||
pod/dcgmproftester created
|
||
$ kubectl apply -f notebook-example.yml
|
||
service/tf-notebook created
|
||
pod/tf-notebook created
|
||
```
|
||
|
||
#### 查看 GPU 处于已分配状态:
|
||
|
||
```plain
|
||
$ kubectl describe node worker-gpu-001
|
||
---
|
||
Allocated resources:
|
||
(Total limits may be over 100 percent, i.e., overcommitted.)
|
||
Resource Requests Limits
|
||
-------- -------- ------
|
||
cpu 1087m (6%) 1680m (10%)
|
||
memory 1440Mi (2%) 1510Mi (2%)
|
||
ephemeral-storage 0 (0%) 0 (0%)
|
||
nvidia.com/gpu 1 1 #check this
|
||
Events: <none>
|
||
```
|
||
|
||
当有 GPU 任务发布给平台时,GPU 资源从可分配状态转变为已分配状态,安装任务发布的先后顺序,第二个任务在第一个任务运行结束后开始运行:
|
||
|
||
```plain
|
||
$ kubectl get pods --watch
|
||
NAME READY STATUS RESTARTS AGE
|
||
dcgmproftester 1/1 Running 0 76s
|
||
tf-notebook 0/1 Pending 0 58s
|
||
------
|
||
NAME READY STATUS RESTARTS AGE
|
||
dcgmproftester 0/1 Completed 0 4m22s
|
||
tf-notebook 1/1 Running 0 4m4s
|
||
```
|
||
|
||
获取应用端口信息:
|
||
|
||
```plain
|
||
$ kubectl get svc # get the nodeport of the svc, 30001
|
||
gpu-operator-1611672791-node-feature-discovery ClusterIP 10.233.10.222 <none> 8080/TCP 12h
|
||
kubernetes ClusterIP 10.233.0.1 <none> 443/TCP 12h
|
||
tf-notebook NodePort 10.233.53.116 <none> 80:30001/TCP 7m52s
|
||
```
|
||
|
||
查看日志,获取登录口令:
|
||
|
||
```plain
|
||
$ kubectl logs tf-notebook
|
||
[I 21:50:23.188 NotebookApp] Writing notebook server cookie secret to /root/.local/share/jupyter/runtime/notebook_cookie_secret
|
||
[I 21:50:23.390 NotebookApp] Serving notebooks from local directory: /tf
|
||
[I 21:50:23.391 NotebookApp] The Jupyter Notebook is running at:
|
||
[I 21:50:23.391 NotebookApp] http://tf-notebook:8888/?token=3660c9ee9b225458faaf853200bc512ff2206f635ab2b1d9
|
||
[I 21:50:23.391 NotebookApp] or http://127.0.0.1:8888/?token=3660c9ee9b225458faaf853200bc512ff2206f635ab2b1d9
|
||
[I 21:50:23.391 NotebookApp] Use Control-C to stop this server and shut down all kernels (twice to skip confirmation).
|
||
[C 21:50:23.394 NotebookApp]
|
||
To access the notebook, open this file in a browser:
|
||
file:///root/.local/share/jupyter/runtime/nbserver-1-open.html
|
||
Or copy and paste one of these URLs:
|
||
http://tf-notebook:8888/?token=3660c9ee9b225458faaf853200bc512ff2206f635ab2b1d9
|
||
or http://127.0.0.1:8888/?token=3660c9ee9b225458faaf853200bc512ff2206f635ab2b1d9
|
||
```
|
||
|
||
通过查看应用的日志,我们拿到登录口令后,就可以顺利进入 notebook 开发环境:
|
||
|
||
```plain
|
||
http:://<your-machine-ip>:30001/?token=3660c9ee9b225458faaf853200bc512ff2206f635ab2b1d9
|
||
```
|
||
|
||
#### 运行深度学习任务
|
||
|
||
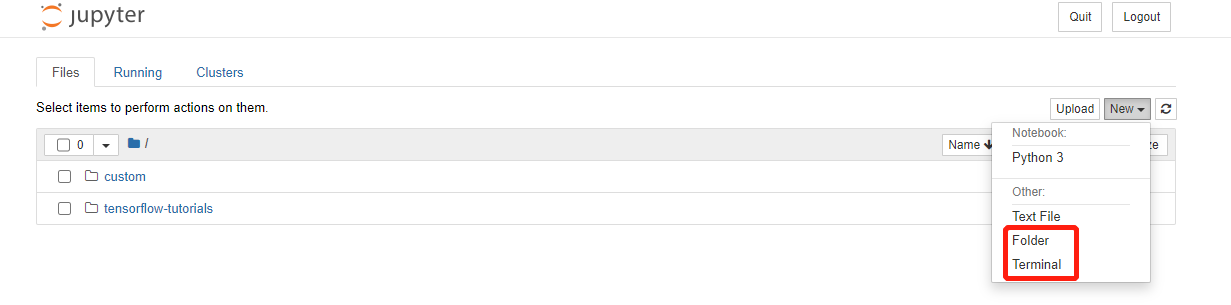
进入`jupyter notebook` 环境后,尝试进入终端,运行深度学习任务:
|
||
|
||
|
||
|
||
|
||
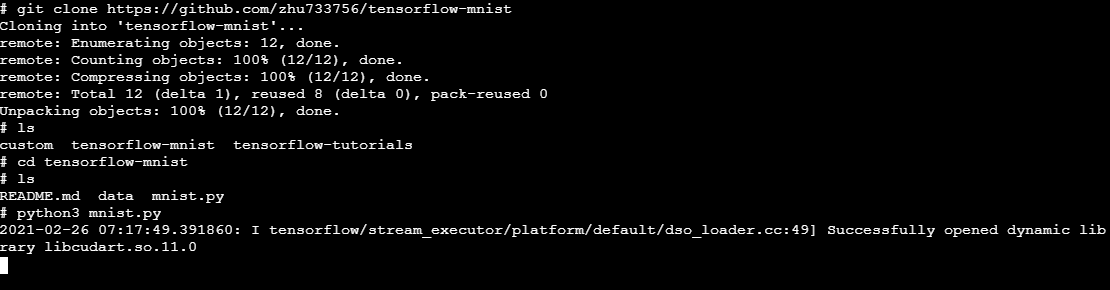
进入`terminal`后拉取`tersorflow`测试代码并运行:
|
||
|
||
|
||
|
||
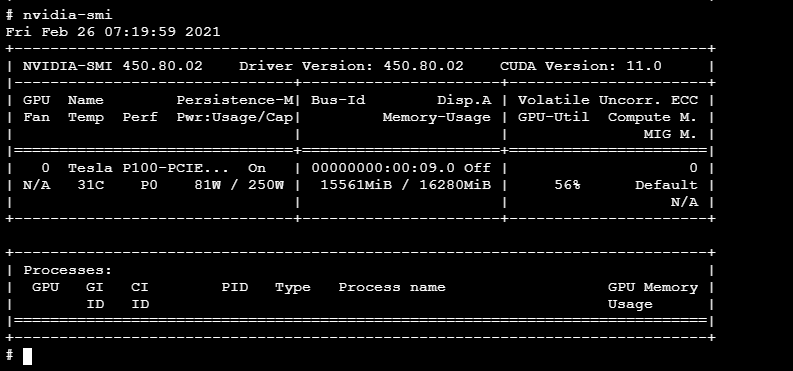
与此同时,开启另外一个终端运行`nvidia-smi`查看 GPU 监控使用情况:
|
||
|
||
|
||
|
||
## 利用 KubeSphere 自定义监控功能监控 GPU
|
||
|
||
### 部署 ServiceMonitor
|
||
|
||
`gpu-operator`帮我们提供了`nvidia-dcgm-exporter`这个`exportor`, 只需要将它集成到`Prometheus`的可采集对象中,也就是`ServiceMonitor`中,我们就能获取GPU监控数据了:
|
||
|
||
```plain
|
||
$ kubectl get pods -n gpu-operator-resources
|
||
NAME READY STATUS RESTARTS AGE
|
||
gpu-feature-discovery-ff4ng 1/1 Running 2 15h
|
||
nvidia-container-toolkit-daemonset-2vxjz 1/1 Running 0 15h
|
||
nvidia-dcgm-exporter-pqwfv 1/1 Running 0 5h27m #here
|
||
nvidia-device-plugin-daemonset-42n74 1/1 Running 0 5h27m
|
||
nvidia-device-plugin-validation 0/1 Completed 0 5h27m
|
||
nvidia-driver-daemonset-dvd9r 1/1 Running 3 15h
|
||
```
|
||
|
||
可以构建一个`busybox`查看该`exporter`暴露的指标:
|
||
|
||
```plain
|
||
$ kubectl get svc -n gpu-operator-resources
|
||
NAME TYPE CLUSTER-IP EXTERNAL-IP PORT(S) AGE
|
||
gpu-operator-node-feature-discovery ClusterIP 10.233.54.111 <none> 8080/TCP 56m
|
||
nvidia-dcgm-exporter ClusterIP 10.233.53.196 <none> 9400/TCP 54m
|
||
$ kubectl exec -it busybox-sleep -- sh
|
||
$ wget http://nvidia-dcgm-exporter.gpu-operator-resources:9400/metrics
|
||
$ cat metrics
|
||
----
|
||
DCGM_FI_DEV_SM_CLOCK{gpu="0",UUID="GPU-eeff7856-475a-2eb7-6408-48d023d9dd28",device="nvidia0",container="tf-notebook",namespace="default",pod="tf-notebook"} 405
|
||
DCGM_FI_DEV_MEM_CLOCK{gpu="0",UUID="GPU-eeff7856-475a-2eb7-6408-48d023d9dd28",device="nvidia0",container="tf-notebook",namespace="default",pod="tf-notebook"} 715
|
||
DCGM_FI_DEV_GPU_TEMP{gpu="0",UUID="GPU-eeff7856-475a-2eb7-6408-48d023d9dd28",device="nvidia0",container="tf-notebook",namespace="default",pod="tf-notebook"} 30
|
||
----
|
||
```
|
||
|
||
查看`nvidia-dcgm-exporter`暴露的`svc`和`ep`:
|
||
|
||
```plain
|
||
$ kubectl describe svc nvidia-dcgm-exporter -n gpu-operator-resources
|
||
Name: nvidia-dcgm-exporter
|
||
Namespace: gpu-operator-resources
|
||
Labels: app=nvidia-dcgm-exporter
|
||
Annotations: prometheus.io/scrape: true
|
||
Selector: app=nvidia-dcgm-exporter
|
||
Type: NodePort
|
||
IP: 10.233.28.200
|
||
Port: gpu-metrics 9400/TCP
|
||
TargetPort: 9400/TCP
|
||
NodePort: gpu-metrics 31129/TCP
|
||
Endpoints: 10.233.84.54:9400
|
||
Session Affinity: None
|
||
External Traffic Policy: Cluster
|
||
Events: <none>
|
||
```
|
||
|
||
配置`ServiceMonitor`定义清单:
|
||
|
||
```plain
|
||
$ cat custom/gpu-servicemonitor.yaml
|
||
apiVersion: monitoring.coreos.com/v1
|
||
kind: ServiceMonitor
|
||
metadata:
|
||
name: nvidia-dcgm-exporter
|
||
namespace: gpu-operator-resources
|
||
labels:
|
||
app: nvidia-dcgm-exporter
|
||
spec:
|
||
jobLabel: nvidia-gpu
|
||
endpoints:
|
||
- port: gpu-metrics
|
||
interval: 15s
|
||
selector:
|
||
matchLabels:
|
||
app: nvidia-dcgm-exporter
|
||
namespaceSelector:
|
||
matchNames:
|
||
- gpu-operator-resources
|
||
$ kubectl apply -f custom/gpu-servicemonitor.yaml
|
||
```
|
||
|
||
### 检查 GPU 指标是否被采集到(可选)
|
||
|
||
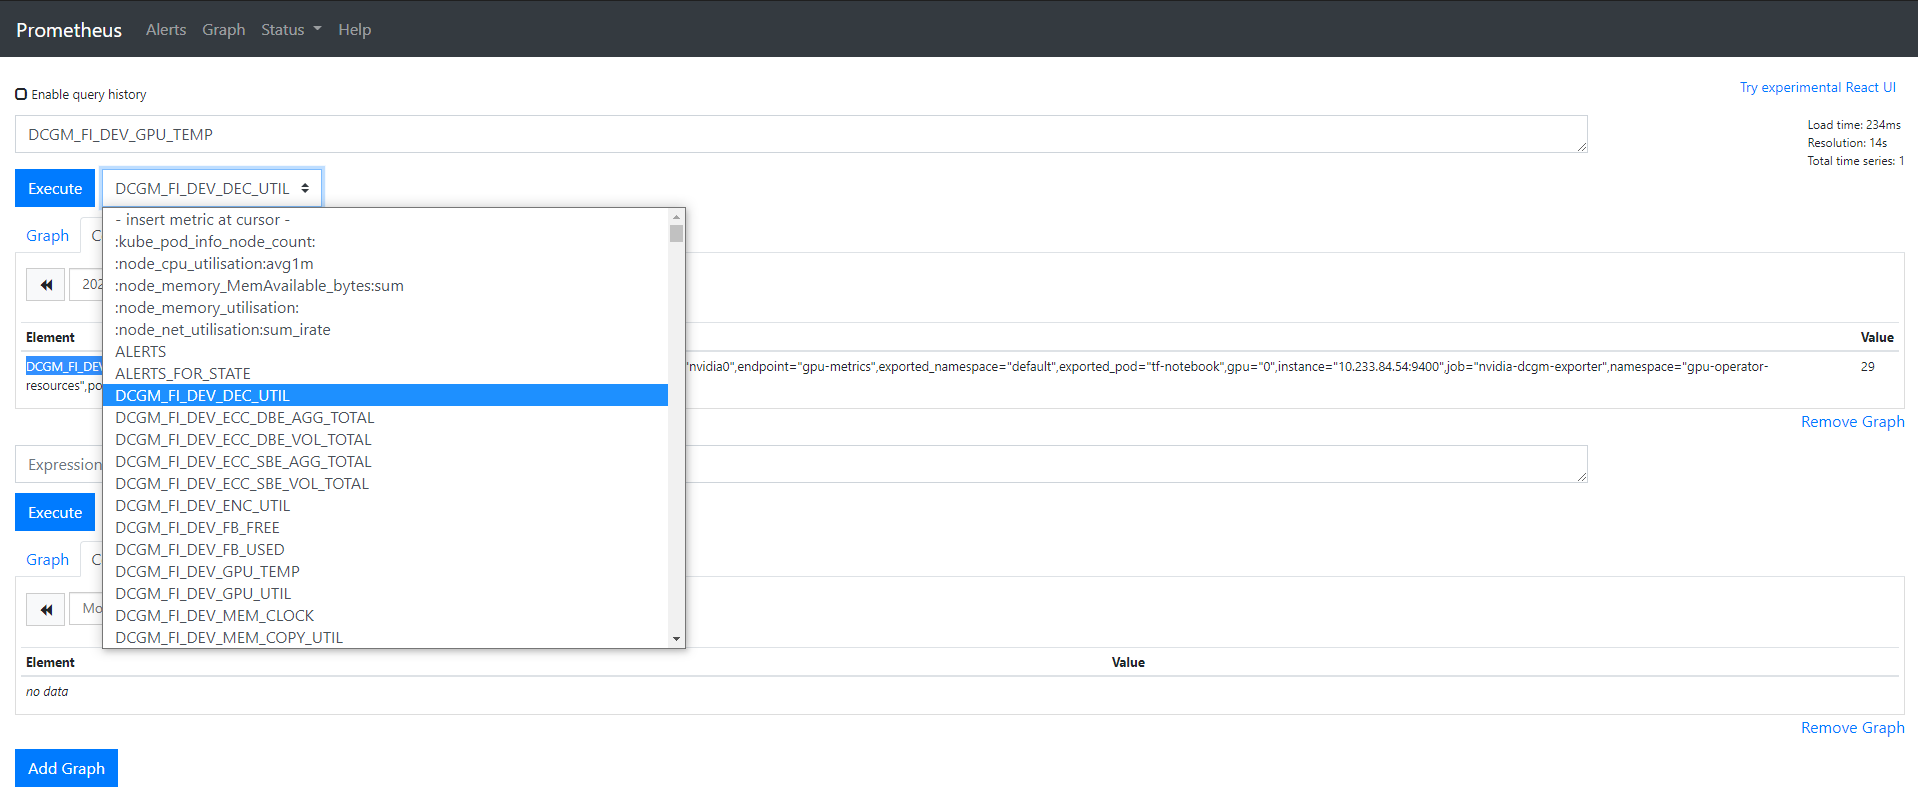
将`servicemonitor`提交给`kubesphere`平台后,通过暴露`prometheus-k8s`为`NodePort`,我们可以在`Prometheus`的`UI`上验证一下是否采集到的相关指标:
|
||
|
||
|
||
|
||
### 创建 KubeSphere GPU 自定义监控面板
|
||
|
||
#### `KubeSphere 3.0`
|
||
|
||
如果部署的 KubeSphere 版本是`KubeSphere 3.0`,需要简单地配置以下几个步骤,便可顺利完成可观测性监控。
|
||
|
||
首先, 登录`kubsphere console`后,创建一个企业空间名称为`ks-monitoring-demo`, 名称可按需创建;
|
||
|
||
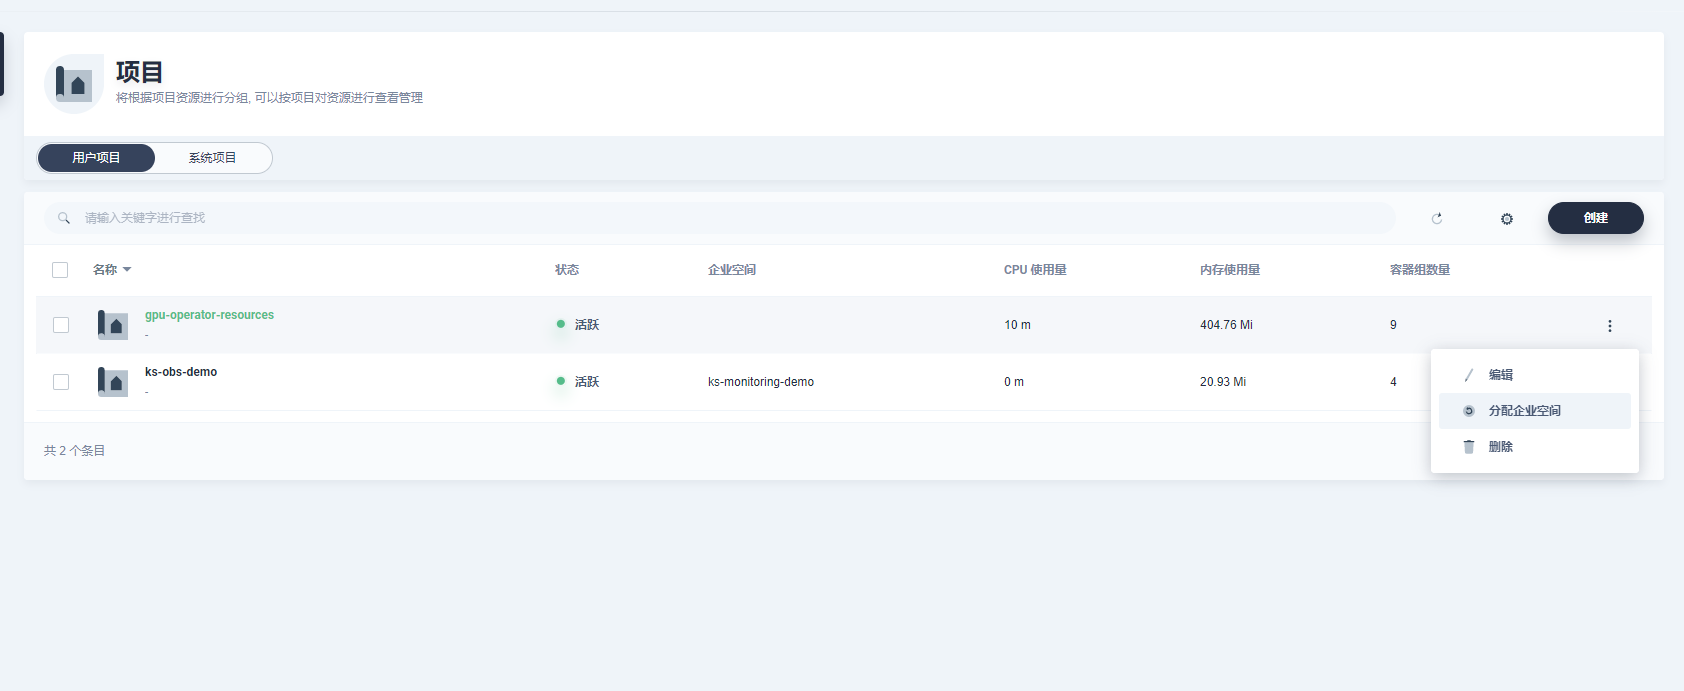
其次,需要将`ServiceMonitor`所在的目标名称空间`gpu-operator-resources`分配为已存在的企业空间中,以便纳入监控。
|
||
|
||
|
||
|
||
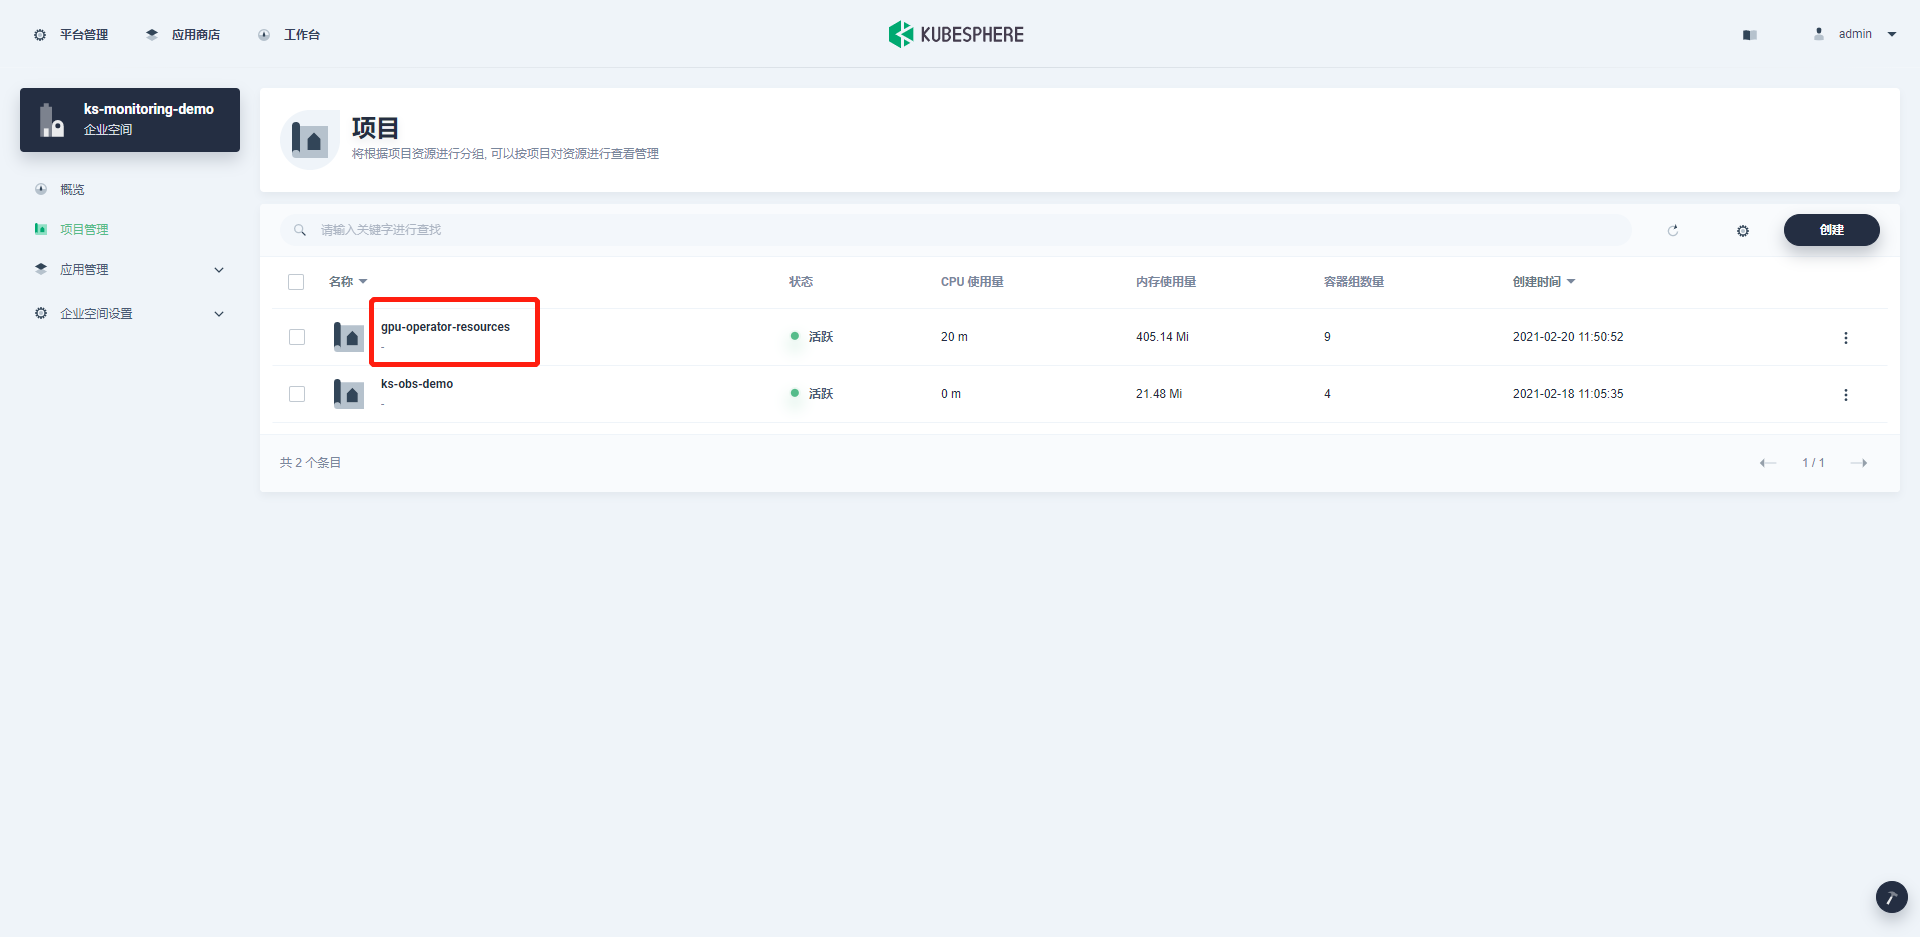
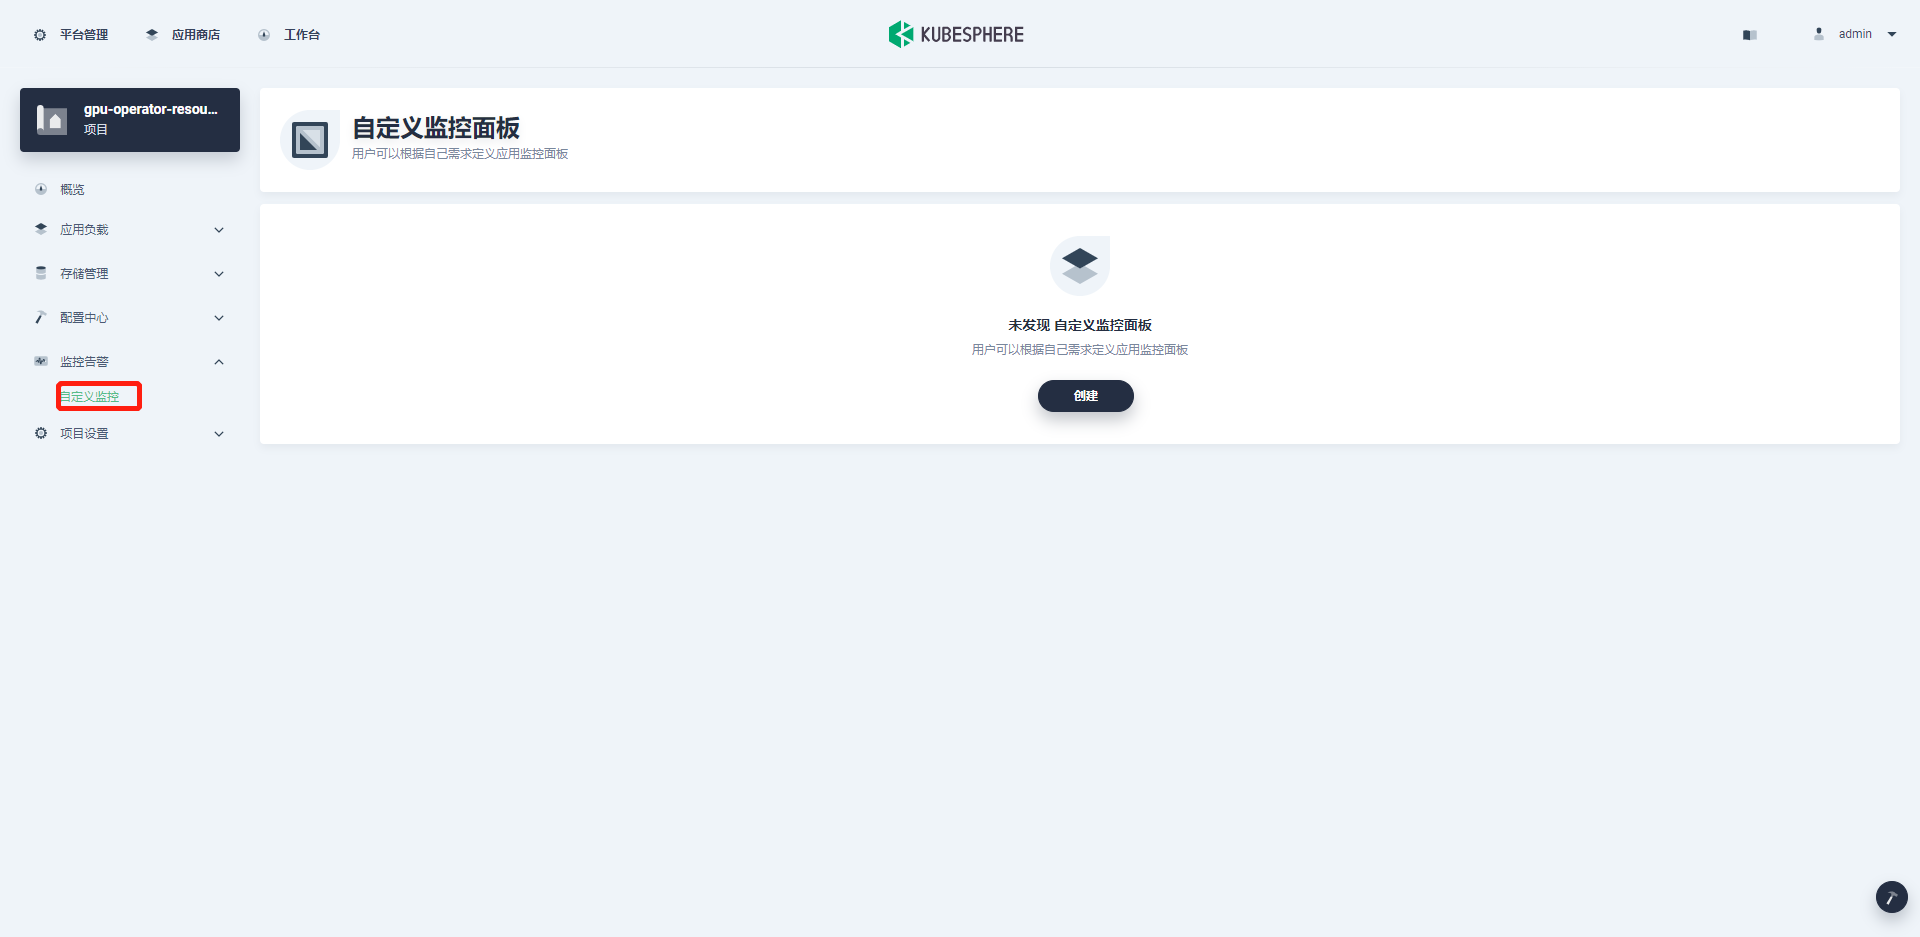
最后,进入目标企业空间,在纳管的项目找到`gpu-operator-resources`, 点击后找到可自定义监控界面, 即可添加自定义监控。
|
||
|
||
|
||
|
||
|
||
|
||
|
||
#### 创建自定义监控
|
||
|
||
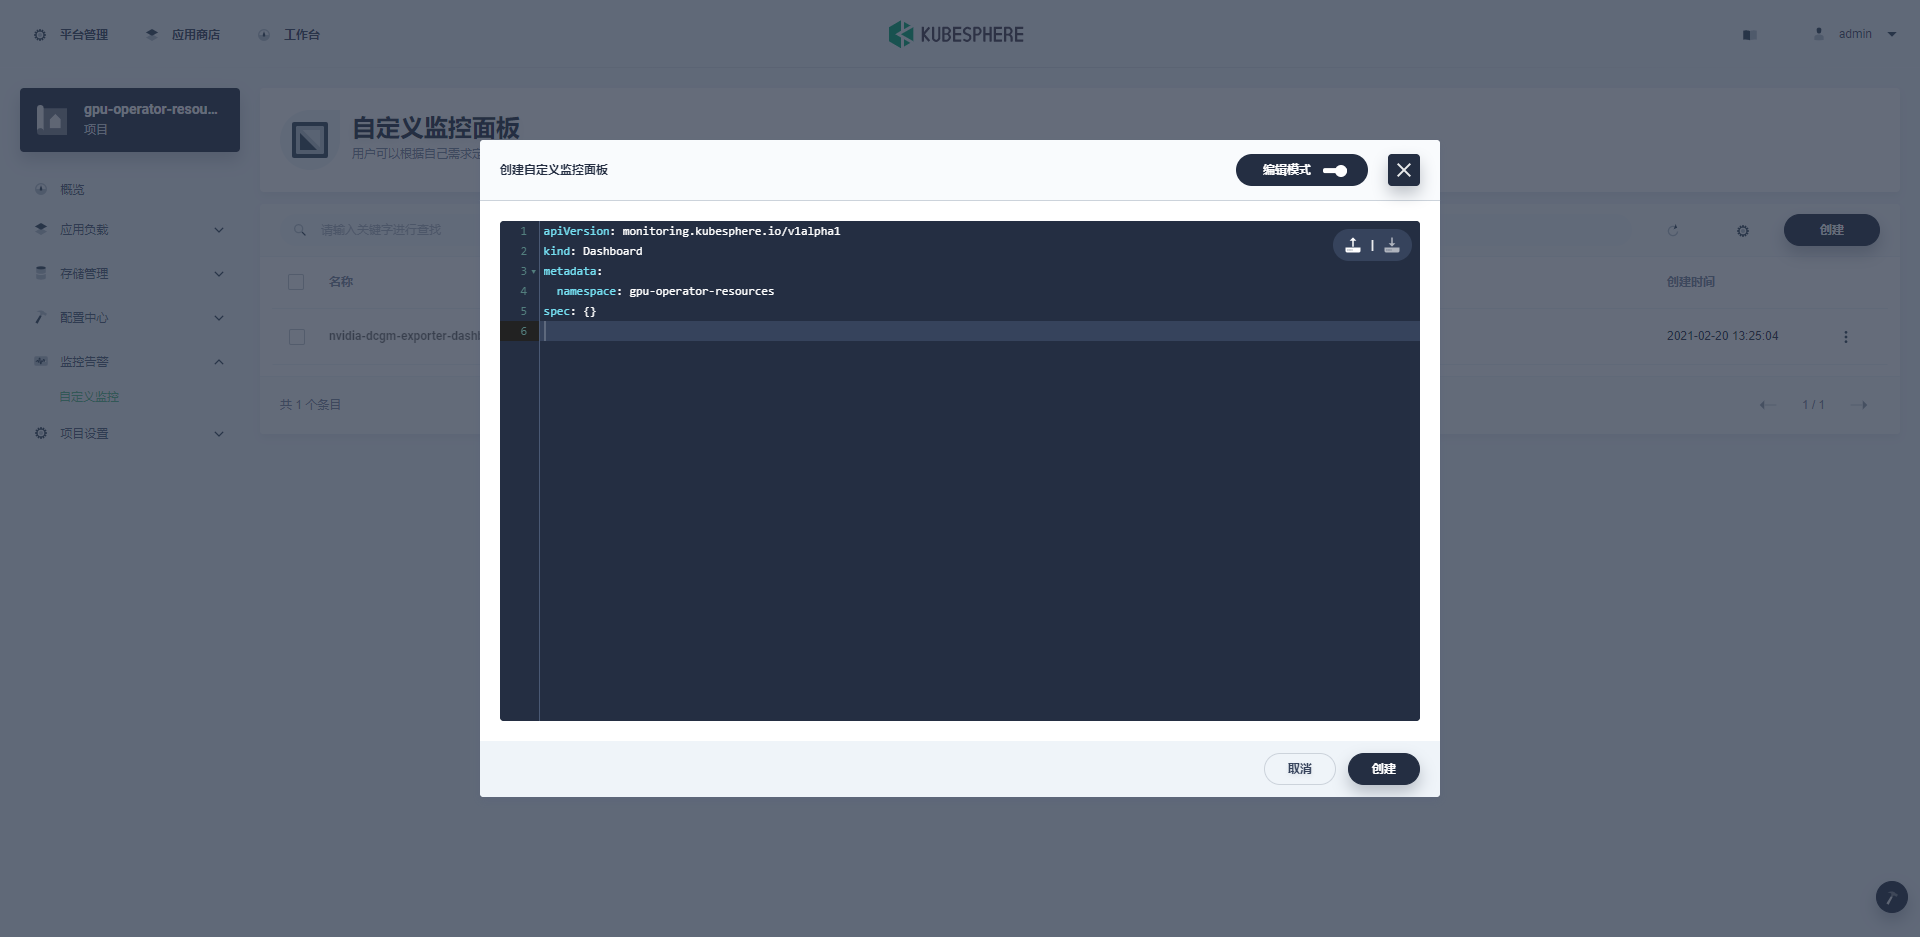
下载`nvidia-gpu-dcgm-exporter-dashboard`并配置`namespace`:
|
||
|
||
```plain
|
||
$ curl -LO https://raw.githubusercontent.com/kubesphere/monitoring-dashboard/master/contrib/gallery/nvidia-gpu-dcgm-exporter-dashboard.yaml
|
||
$ cat nvidia-gpu-dcgm-exporter-dashboard.yaml
|
||
----
|
||
apiVersion: monitoring.kubesphere.io/v1alpha1
|
||
kind: Dashboard
|
||
metadata:
|
||
name: nvidia-dcgm-exporter-dashboard-rev1
|
||
namespace: gpu-operator-resources # check here
|
||
spec:
|
||
-----
|
||
```
|
||
|
||
可以直接命令行`apply`或者在自定义监控面板中选择编辑模式进行导入:
|
||
|
||
|
||
正确导入后:
|
||
|
||
|
||
|
||
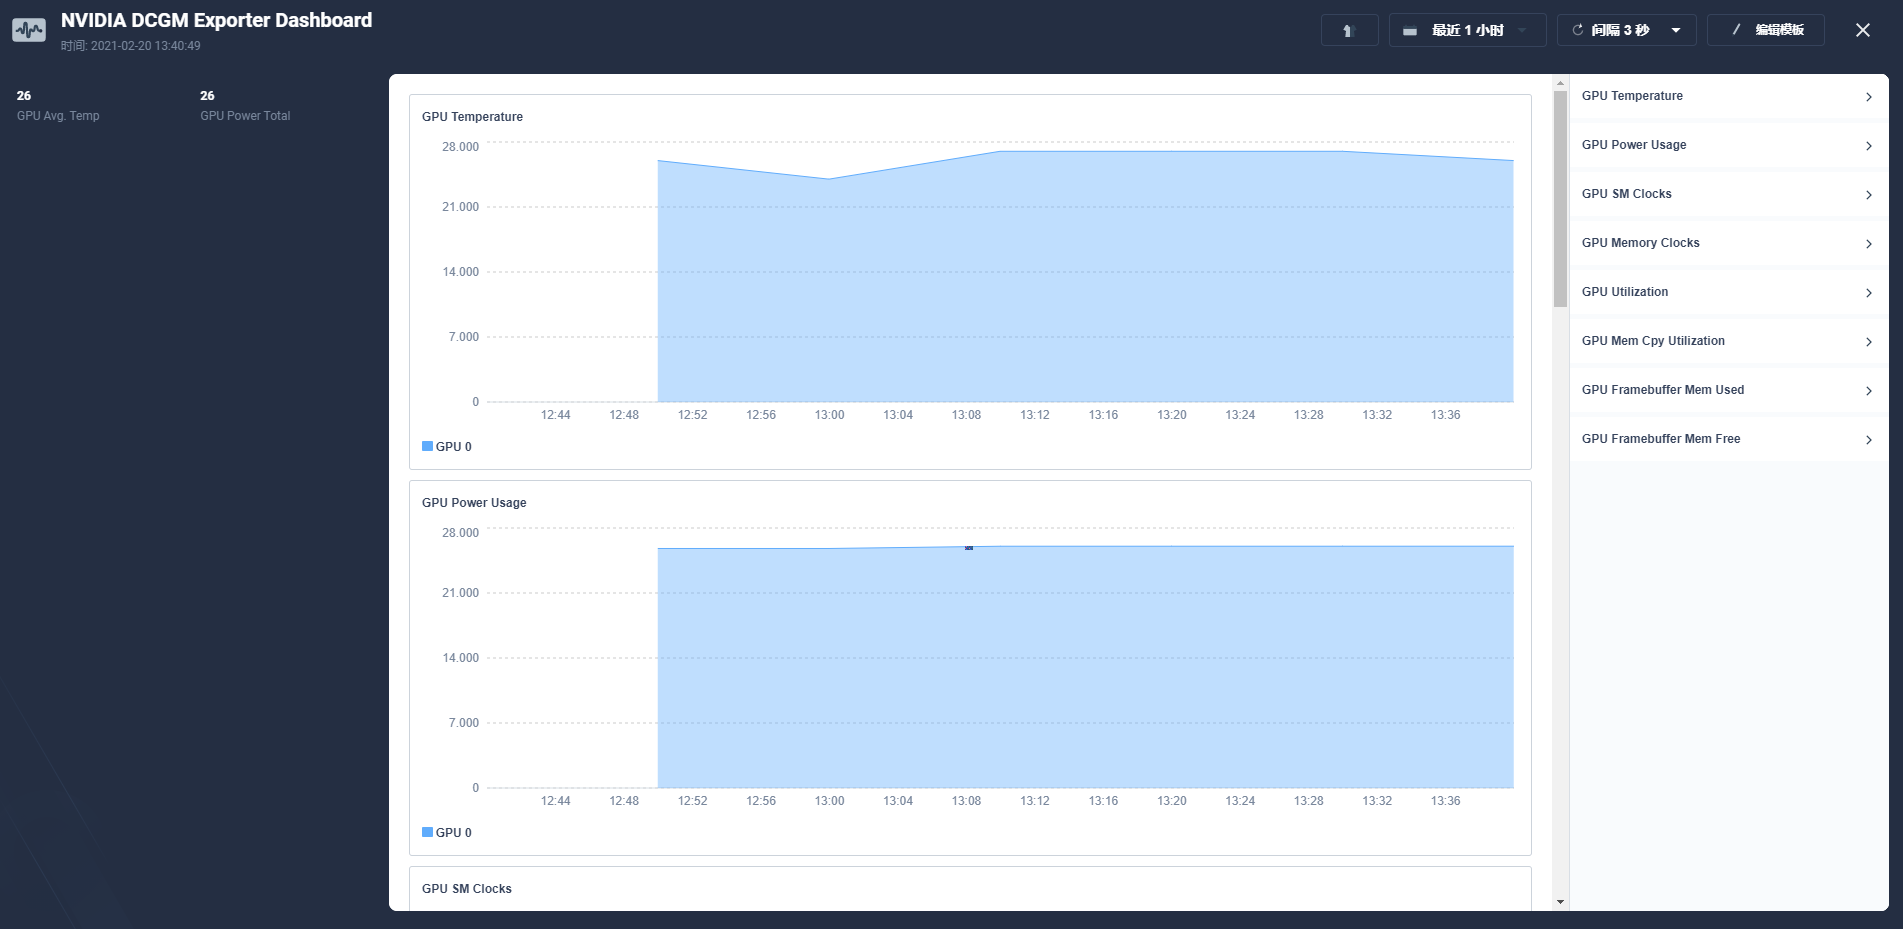
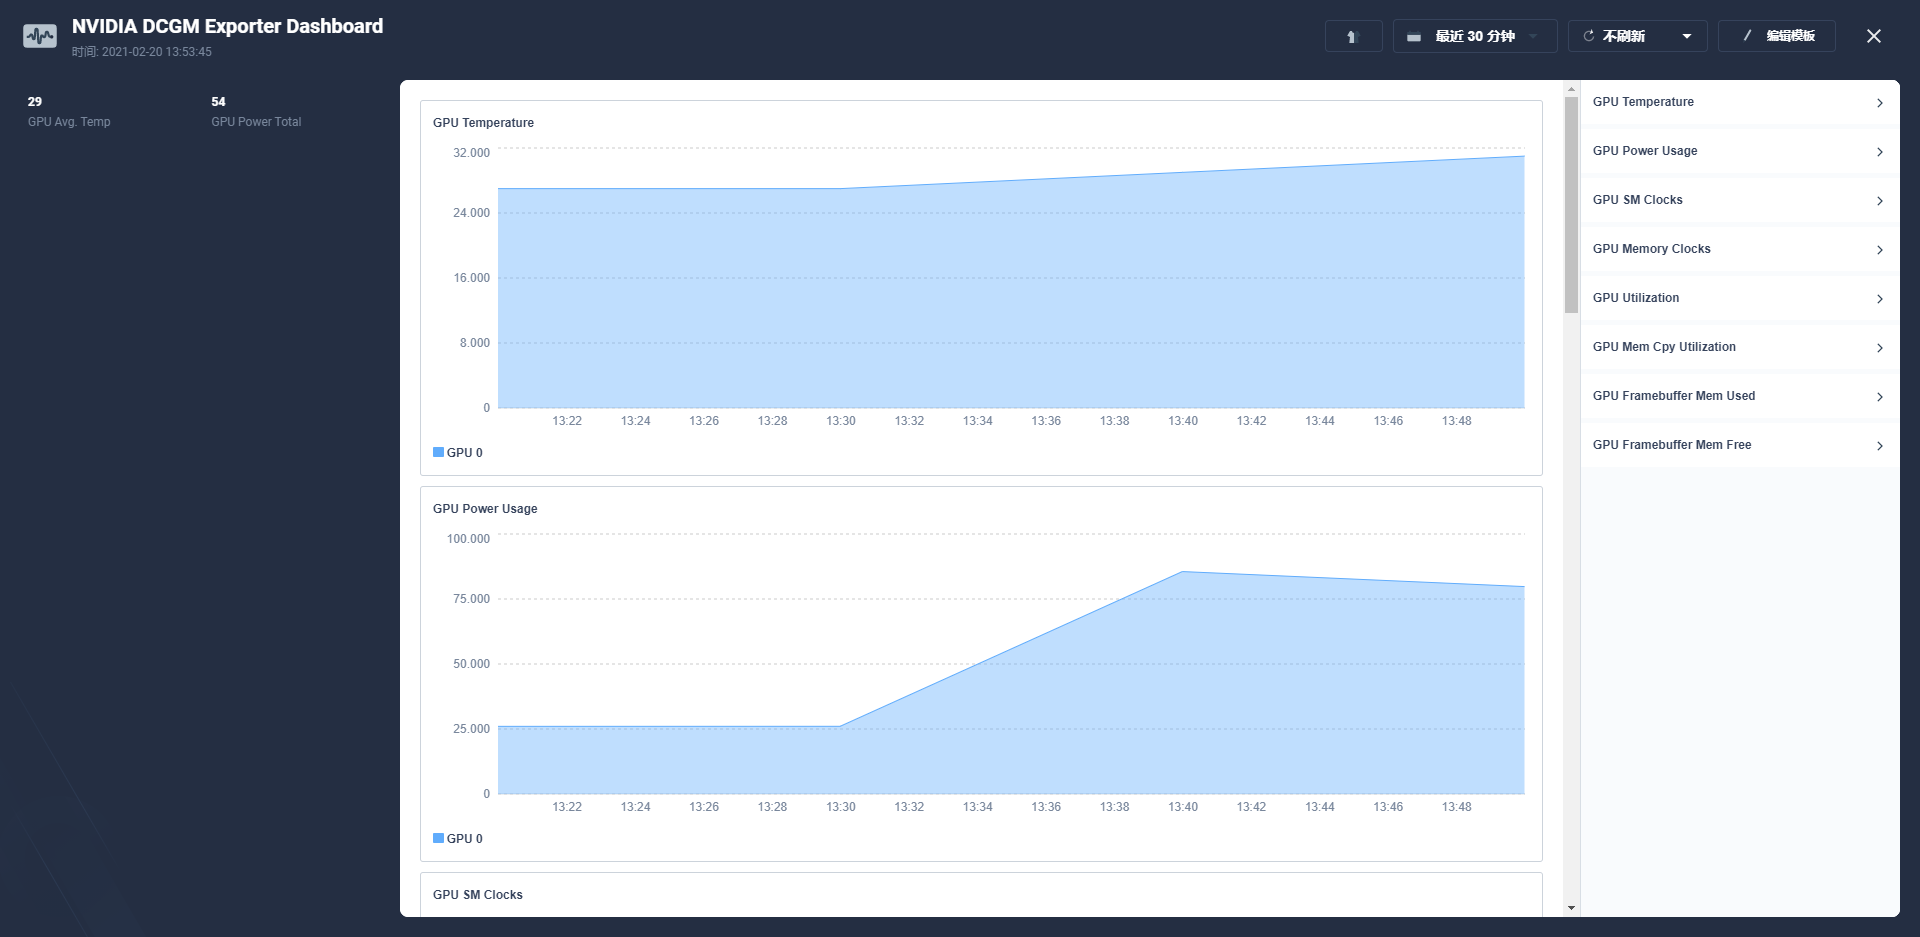
在上面创建的`jupyter notebook`运行深度学习测试任务后,可以明显地观察到相关GPU指标变化:
|
||
|
||
|
||
|
||
## 卸载 GPU-Operator
|
||
|
||
```plain
|
||
$ helm list -n gpu-operator-resources
|
||
NAME NAMESPACE REVISION UPDATED STATUS CHART APP VERSION
|
||
gpu-operator gpu-operator-resources 1 2021-02-20 11:50:56.162559286 +0800 CST deployed gpu-operator-1.5.2 1.5.2
|
||
$ helm uninstall gpu-operator -n gpu-operator-resources
|
||
```
|
||
|
||
## GPU-Operator 常见问题
|
||
|
||
|
||
#### GPU-Operator 重启后无法使用
|
||
|
||
答:关于已部署正常运行的gpu-operator和 AI 应用的集群,重启 GPU 主机后会出现没法用上 GPU 的情况,极有可能是因为插件还没加载,应用优先进行了载入,就会导致这种问题。这时,只需要优先保证插件运行正常,然后重新部署应用即可。
|
||
|
||
#### Nvidia k8s-device-plugin 与 GPU-Operator 方案对比?
|
||
|
||
我之前针对GPU使用的是 https://github.com/NVIDIA/k8s-device-plugin 和 https://github.com/NVIDIA/gpu-monitoring-tools 相结合的方案来监控 GPU,请问这个方案与 GPU-Operator的方案相比,孰优孰劣一些?
|
||
|
||
答:个人认为 GPU-Operator 更简单易用,其自带 GPU 注入能力不需要构建专用的 OS,并且支持节点发现与可插拔,能够自动化集成管理 GPU 所需的 NVIDIA 设备组件,相对来说还是很省事的。
|
||
|
||
## 参考资料
|
||
|
||
### 官方代码仓库
|
||
|
||
GitHub: https://github.com/NVIDIA/gpu-operator
|
||
|
||
GitLab: https://gitlab.com/nvidia/kubernetes/gpu-operator
|
||
|
||
### 官方文档
|
||
|
||
GPU-Operator 快速入门:
|
||
|
||
https://docs.nvidia.com/datacenter/cloud-native/gpu-operator/getting-started.html#install-nvidia-gpu-operator
|
||
|
||
GPU-Operator 离线安装指南:
|
||
|
||
https://docs.nvidia.com/datacenter/cloud-native/gpu-operator/getting-started.html#considerations-to-install-in-air-gapped-clusters
|
||
|
||
KubeSphere 自定义监控使用文档:
|
||
|
||
https://kubesphere.com.cn/docs/project-user-guide/custom-application-monitoring/examples/monitor-mysql/# |